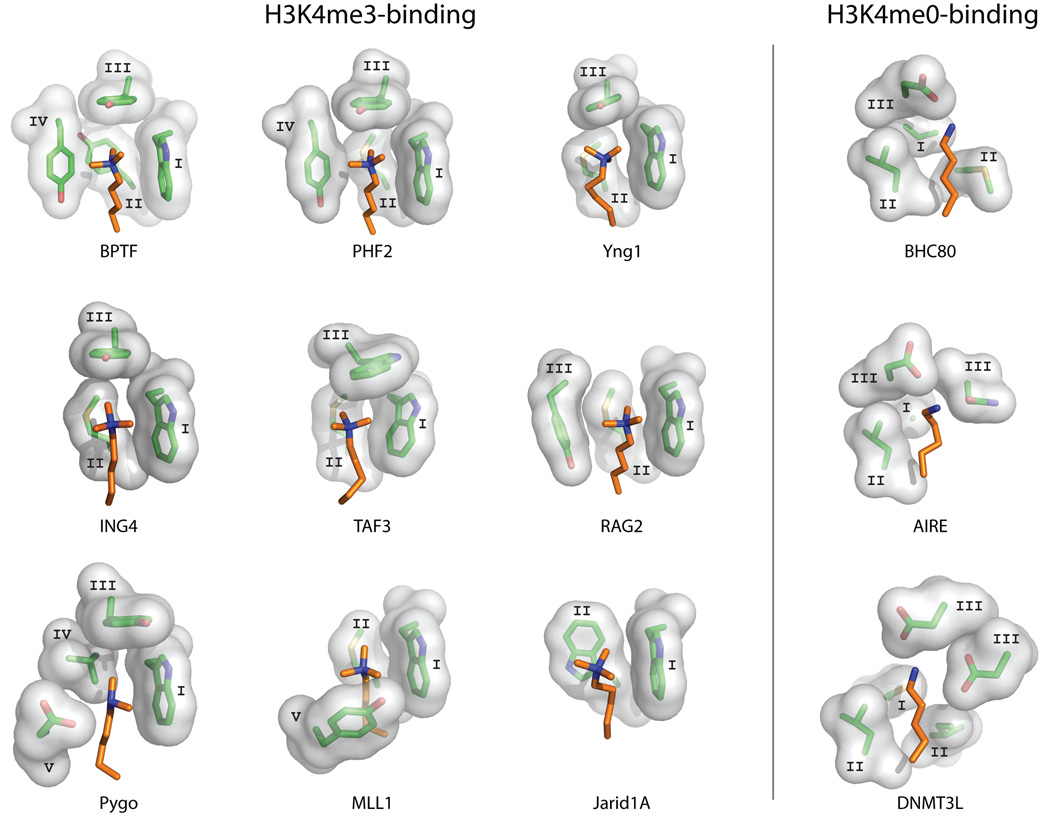
Figure 3. Ligand recognition sites in PHD fingers recognizing H3K4me3 or H3K4me0.
The binding sites are illustrated by showing the sidechains of the PHD finger residues (stick and surface representation) that surround the H3K4 ligand residue (shown in orange). (i) The different versions of aromatic cages used for recognition of H3K4me3 are shown. (ii) H3K4me0 binding sites are shown. The binding site residues are labeled according to the sequence regions defined in Figure 1. The PDB structures used to create this figure are listed in Figure 2.

