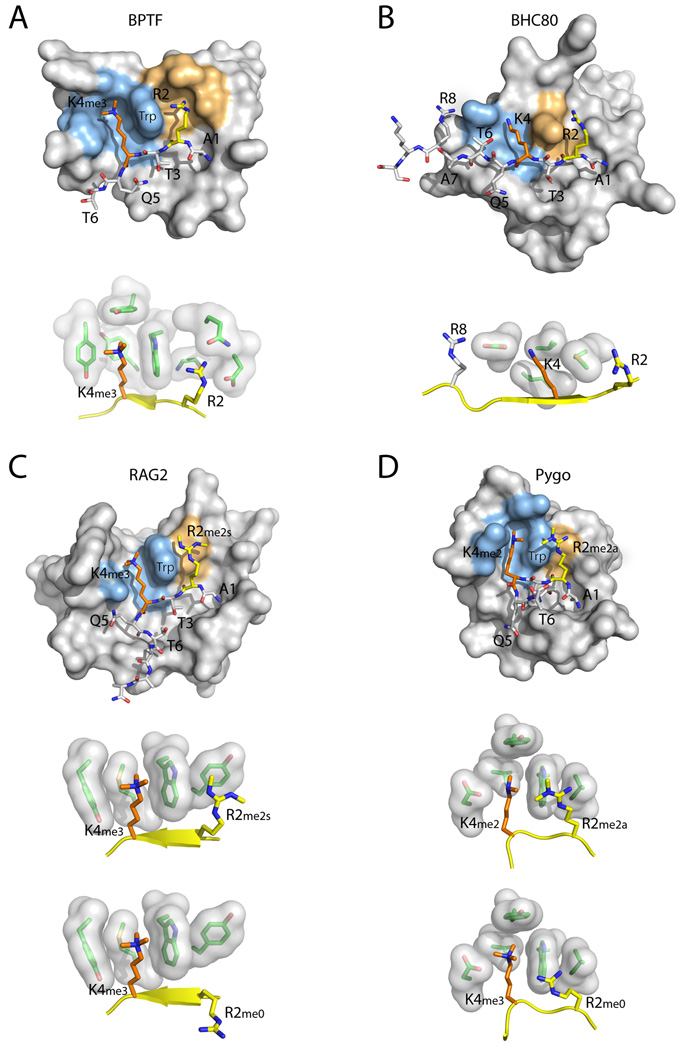
Figure 4. Recognition of multiple H3 residues by PHD fingers.
The structures of representative PHD fingers bound to H3 peptides with different combinations of H3K4 and H3R2 methylation states are shown. The close-up images show the residues involved in recognition of H3K4 and H3R2. (A) BPTF PHD bound an H3 R2me0;K4me3 peptide. (B) BHC80 PHD bound to an H3 R2me0;K4me0 peptide. (C) RAG2 PHD bound to an H3 R2me2s;K4me3 peptide (the bottom image shows an H3 R2me0;K4me3 peptide). (D) PYGO PHD bound to an H3 R2me2a;K4me2 peptide (the bottom image shows an H3 R2me0;K4me3 peptide). The H3 N-terminal peptide is shown in stick representation, with H3K4 in orange and H3R2 in yellow. The H3K4 recognition environment is colored light blue on the surface of the PHD finger, and the H3R2 recognition environment is colored orange. In the close-up images, the H3 peptide is shown in yellow cartoon representation.

