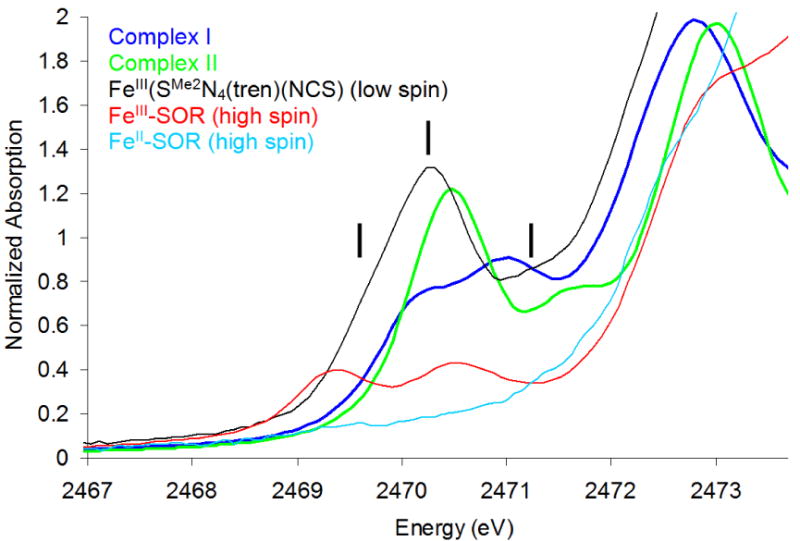
Figure 2.

S K-edge XAS spectra of complex I ({FeNO}7, S=3/2, blue), complex II ({FeNO}7, S=1/2, green), FeIII-SOR (high spin, red), FeIII(SMe2N4(tren))(NCS) (low spin, black) and FeII-SOR (high spin, light blue). The vertical lines indicate the three pre-edge features associated with transitions to 1A1, to 3T1, 3T2 and 1T1, and to 1T2 states for FeIII(SMe2N4(tren))(NCS).
