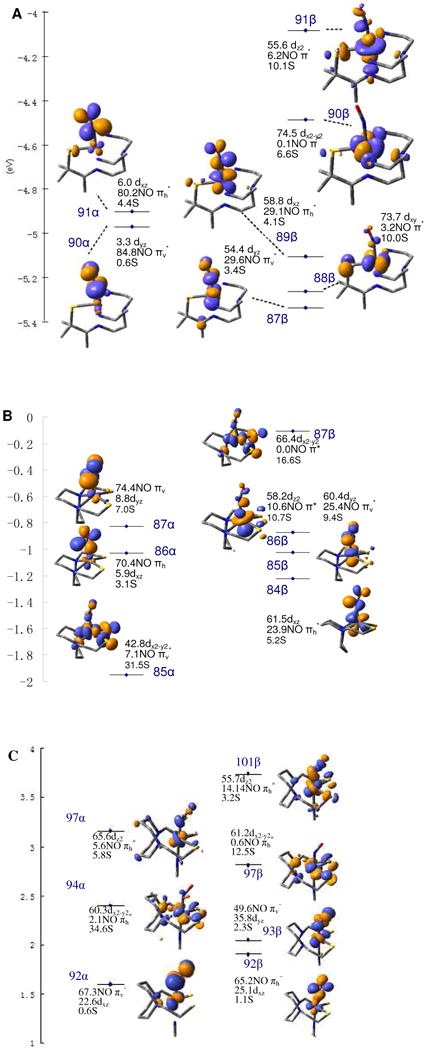
Figure 4.

MO diagrams of complex I (A), complex II (B) and complex II + axial L (C). (Only unoccupied orbitals are shown. Occupied orbitals are in Figure S1-S3.) Numbers shown are the percentage of Fe d, NO2p and S3p orbitals in each MO. α contours are shown on the left and β contours on the right.
