
Figure 8.
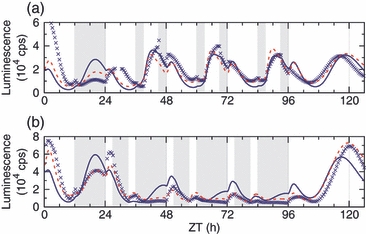
The response to skeleton light conditions depends on the light intensity.The predictive power of the model was tested by replacing the middle 6 h of the night (a) or day (b) in L:D 12:12 with light (a) or darkness (b), for three cycles, followed by transfer to constant light. This experiment used a lower light intensity than previous experiments (see Experimental procedures). The measured response of CCA1–LUC (blue crosses) is similar to the model prediction for normal light intensity (solid blue lines), but is better matched by the prediction for low (30%) light intensity (dashed red lines).