Figure 2.

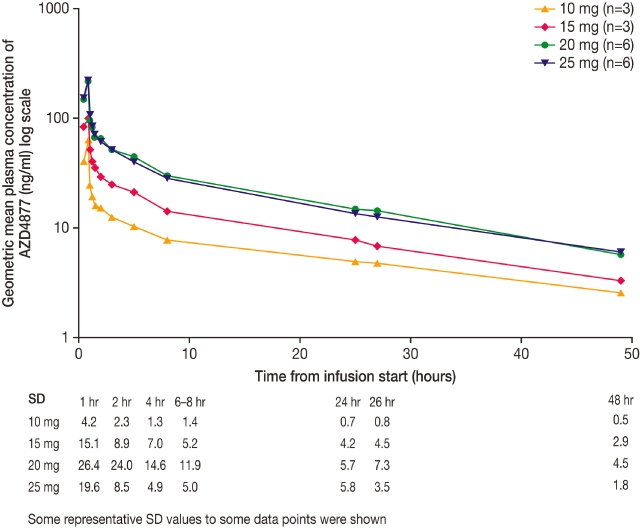
Geometric mean plasma concentration of AZD4877 versus time by dose level following single dosing. SD=standard deviation.

Geometric mean plasma concentration of AZD4877 versus time by dose level following single dosing. SD=standard deviation.