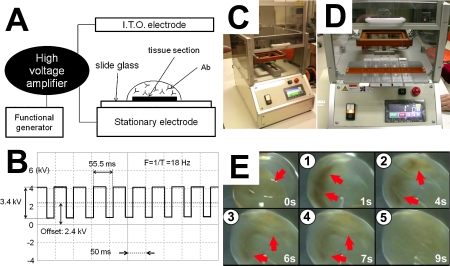
Fig. 1.
New device for AC electric field IHC. Panel A depicts a schematic diagram of a device for AC electric field IHC analysis. Panel B depicts a typical oscilloscope trace of the voltage and frequency of the AC electric field. A high voltage (3.4 kV, offset 2.4 kV), low frequency (18 Hz) AC electric field was applied to the sections. Panels 1C and 1D show the device, which was equipped with a humidifier to prevent evaporation of the antibody solution. To visualize the mixing effect of the device, the AC electric field was also applied to ferrite particles (average diameter: 50 nm) in PBS. Note that the brown particles (red arrows) were unevenly distributed at 1 and 4 sec, but were well mixed and homogeneously distributed within 9 sec (Panel E). I.T.O. electrode, indium tin oxide glass plate electrode; ab, antibody.

