
Fig. 1.
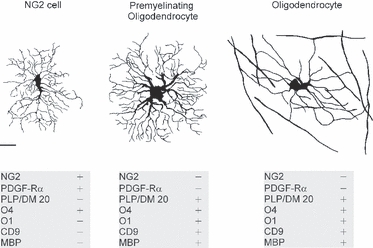
Morphological comparison of the oligodendrocyte lineage cells. Drawings of an NG2 cell, a premyelinating oligodendrocyte and a myelinating oligodendrocyte. The drawings are traced from Lucifer-Yellow-filled cells in brain slices, and represent the typical morphology of oligodendrocyte lineage cells at different stages of differentiation. The grey panels beneath the drawings list some of the important molecular markers that are present (+) or absent (−) in the oligodendrocytes lineage cells. Scale bar: 10 μm (applies to all three drawings). Upper panel is modified with permission from Kukley et al. (2010).