Fig. 3.

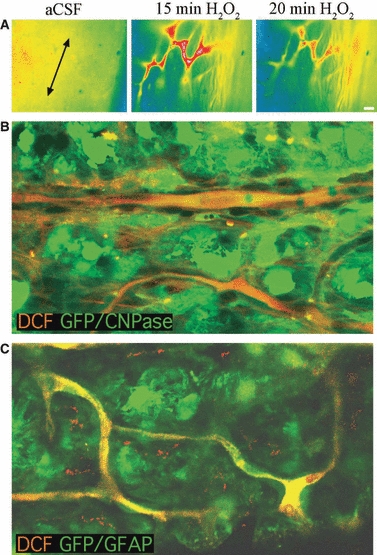
ROS imaging and DCF localization in neonatal optic nerve. (A) Right: A typical wide-field image of the H2-DCDFD loaded P10 rat optic nerve. The long axis of the nerve is indicated by the arrows and the nerve edge is oriented to the right. Note the diffuse nature of the fluorescence in control conditions. Middle: The same region of nerve is shown after 15 min exposure to 100 μm H2O2. Note the bright fluorescence in structures that have the morphological appearance of nerve micro-vessels. Right: The same region of nerve after 20 min exposure to 100 μm H2O2. Note that the fluorescence has started to decline. (B) DCF localization in P10 GFP-CNPase mouse optic nerve. Top, left: DCF fluorescence collected via confocal imaging. Note that laser illumination has caused a rise in DCF in micro-vessels running through the nerve section. Bottom, left: The same section showing GFP within numerous oligodendrocytes, in addition to bleed-through of DCF fluorescence. Right: The images are overlaid, showing that the DCF-loaded endothelial cells of the nerve micro-vessels are distinct from the oligodendrocytes, which largely show no DCF fluorescence. (C) DCF localization in P10 GFP-GFAP mouse optic nerve. Top, left: DCF fluorescence collected via confocal imaging. Note that laser illumination has caused a rise in DCF in micro-vessels. Bottom, left: The same section showing GFP within numerous astrocytes, in addition to bleed-through of DCF fluorescence. Right: The images are overlaid showing that DCF-loaded endothelial cells of the nerve micro-vessels are distinct from the astrocytes, which show no DCF fluorescence. Scale bars: 10 μm. The wide-field DCF images have been pseudo-coloured to indicate fluorescent intensity.
