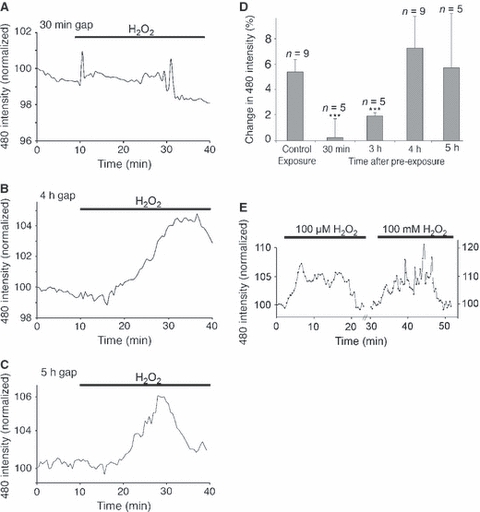
Fig. 5.

Temporal features of rapid ROS scavenging. (A–C) Mean changes in DCF fluorescence evoked by 100 μm H2O2 at 30 min (A), 4 h (B) and 5 h (C) after an initial exposure (20 min 100 μm H2O2 in a Petri dish). Note the absence of response after 30 min and the recovery of response at 4 and 5 h. (D) Mean amplitude of responses to 100 μm H2O2 following a single, control 20-min exposure and at various times after a first exposure. ***P < 0.001 vs. control exposure. (E) Changes in 6C-DCF fluorescence in 6C-H2-DCFDA-loaded nerves. Exposure to 100 μm H2O2 evoked an elevation in 6C-DCF fluorescence that declined to baseline levels in the continued presence of the exogenous ROS. Subsequent application of a high concentration of H2O2 (10 mm) evoked a similar transient 6C-DCF rise. All data plots show mean normalized responses.
