Fig. 3.
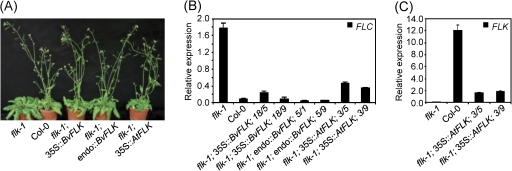
BvFLK complements the A. thaliana flk-1 mutant. (A) Phenotypes at 51 d after sowing of the A. thaliana flk-1 mutant, the ecotype Col-0, and the flk-1 mutant transformed with BvFLK driven by the CaMV 35S promoter (35S::BvFLK), BvFLK driven by the endogenous promoter of BvFLK in sugar beet (endo::BvFLK), or A. thaliana FLK driven by the CaMV 35S promoter (35S::AtFLK) (T1 plants). Plants were grown under long-day conditions. (B) RT-qPCR expression analysis of FLC in flk-1, Col-0, and transgenic T3 plants carrying the 35S::BvFLK, endo::BvFLK, or 35S::AtFLK transgene in the flk-1 mutant background. For each of the transgenic lines, two T3 plants were tested that were derived from different transgenic individuals of a T2 family. (C) RT-qPCR expression analysis of FLK in flk-1, Col-0, and transgenic 35S::AtFLK T3 plants. Expression levels in B and C were normalized against GAPDH and measured in triplicate. Error bars indicate the standard deviations of the mean. (This figure is available in colour at JXB online.)

