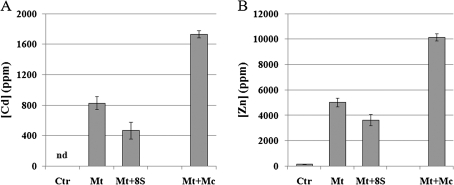
Fig. 2.
Cd and Zn content in shoots of plants submitted to different treatments. Untreated control plants (Ctr); plants treated with 1 mM CdSO4 and 10 mM ZnSO4 (Mt); plants treated with 1 mM CdSO4 and 10 mM ZnSO4 and the addition of the eight selected bacterial strains (Mt+8S); and plants treated with 1 mM CdSO4 and 10 mM ZnSO4 plus autochthonous rhizosphere-derived microorganisms (Mt+Mc). nd: not determined. With the exception of Mt+8S, results are also reported in Farinati et al. (2009). Values shown represent the average of ten plants for three biological replicates (all values are highly statistically significant, P <0.001). Bar, SE.

