Fig. 3.
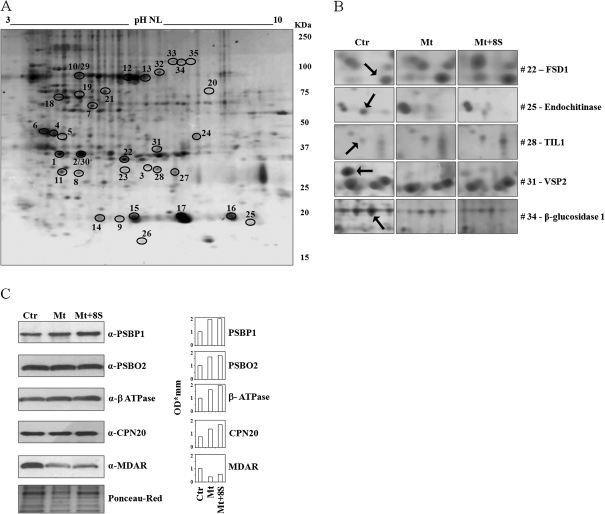
Shoot proteome analysis. (A) Standard 2-DE map of proteins extracted from A. halleri shoots corresponding to the Mt+8S sample, with an average of 346±49 spots (Ctr and Mt samples showed an average of 562±21 and 377±11 spots, respectively). The 35 protein spots showing statistically significant differences between the conditions tested are marked by an open circle and numbered according to Table 4. (B) Close-up view of spots (indicated by arrows) representative of differentially expressed proteins (P <0.05) between control and treatments. (C, left) Validation of five differentially expressed proteins by Western blot (a representative gel of three repetition is reported). Ponceau-Red staining is shown for control of protein loading. (C, right) Densitometric analysis of immunoblot signals.

