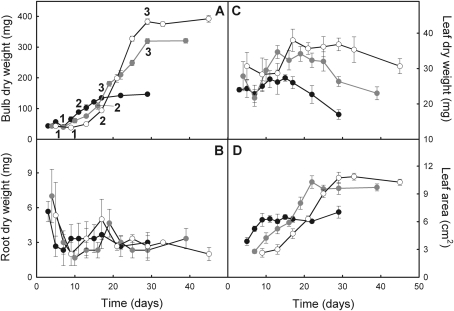
Fig. 2.
Evolution of bulb mass (A), root mass (B), leaf mass (C), and leaf area (D) throughout the epigeous growth period in E. americanum plants grown at 18/14 °C (black), 12/8 °C (grey), and 8/6 °C (white). The first data points correspond to the time when leaves were completely unfolded. The penultimate data points correspond to the first visual signs of leaf senescence and the last data points correspond to complete leaf senescence. The data points identified 1, 2, and 3 on each curve are the lower and upper thresholds used to estimate two different growth rates (see Table 1) during bulb growth. The means ±SE (n=2; six plants per growing season) are presented.

