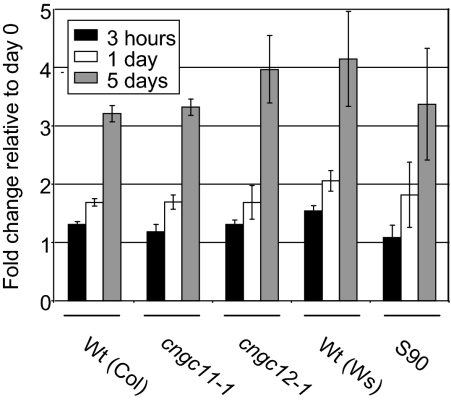
Fig. 4.
Endogenous Ca2+ levels in cngc11-1, cngc12-1, and S90 mutant plants. Seedlings were grown on 0.5× MS agar medium for 2 weeks before being transferred to 50 mM Ca2+ plates and samples were collected 0 h, 3 h, 1 d, and 5 d after transfer. Ca2+ content was determined by ICP-OES. The data are shown as fold change compared with the 0 h value. The presented data are the mean ±SE. The experiment was repeated three times and data from one representative experiment are shown.

