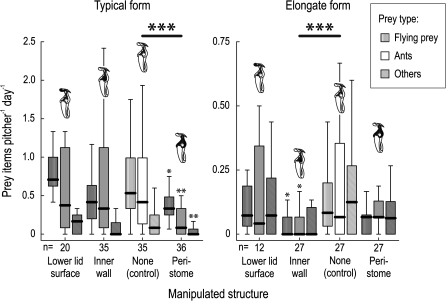
Fig. 2.
Effect of ‘knock-out’ manipulations of individual pitcher components on the natural prey capture success of N. rafflesiana pitchers (typical and elongate form). The effect of each manipulation (grey boxes) was compared with a control group (white boxes). The plot shows medians (centre lines), interquartile ranges (boxes), and the largest and smallest values (whiskers) that are not outliers, separately for the three major functional groups of prey (flying insects, ants, and other arthropods). Large asterisks denote significant differences in overall prey numbers, while small asterisks mark values for individual prey groups that differ significantly from the respective control value (*P <0.05; **P <0.01; ***P <0.001).

