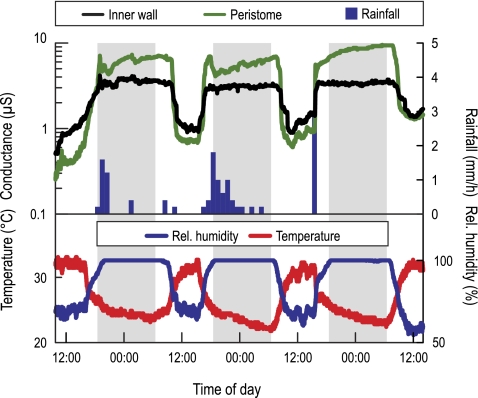
Fig. 5.
Diurnal variation of surface wetness measured on the peristomes and inner walls of three N. rafflesiana (typical form) pitchers (upper graph, curves represent means) in parallel with rainfall (bars), air humidity, and temperature (lower graph). High electrical conductance indicates wetness. (This figure is available in colour at JXB online.)

