Figure 5.
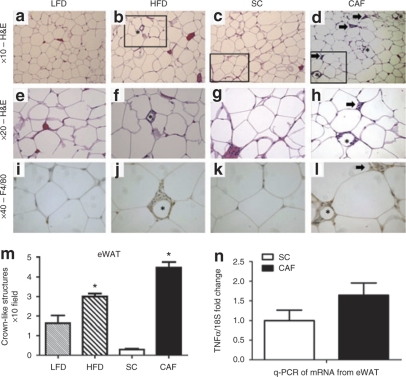
Epididymal white adipose tissue (eWAT) reveals dramatic macrophage infiltration and inflammation in cafeteria diet (CAF)-fed rodents. (a–h) ×10 and ×20 hematoxylin and eosin (H&E) stain of eWAT from (a,e) low-fat diet (LFD), (b,f) high-fat diet (HFD), (c,g) standard chow (SC), and (d,h) CAF. The box indicates areas of interest magnified to ×20 imaging when appropriate. Asterisks indicate crown-like structures (CLS), or areas of macrophage infiltration around adipocytes. Arrow indicates inflammatory loci. (i–l) Macrophage marker F4/80 was used to identify CLS (*) and areas of cells aggregating within inflammatory loci (arrow) (×40). (m) Quantification of CLS revealed a significant twofold increase in HFD- vs. LFD-fed adipose whereas CAF-fed adipose displayed a 17-fold increase over SC. (*CAF P < 0.05 vs. all, ^HFD P < 0.005 vs. all) (n) Pooled stromovascular fractions (SVF) from eWAT enriched in adipose-associated macrophages demonstrated higher expression of tumor necrosis factor α (TNFα) normalized to 18S in CAF-fed rats when compared to SC control animals as determined by qPCR. Representative images shown. (n = 4, SC, LFD, and HFD, n = 5 CAF). See Supplementary Table S4 online for detailed description.

