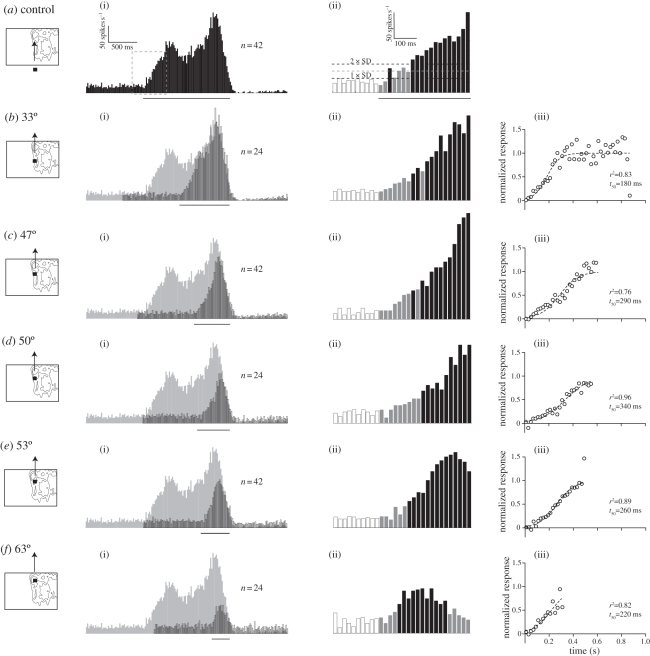
Figure 1.
Response time course. (a(i)) Spike histogram (N = 1, 20 ms bins) showing the response to a 0.9° square black target drifting upwards at 55° s−1 through the CSTMD1 receptive field, with the bar underneath indicating peri-stimulus duration. (ii) The magnification surrounding stimulus onset (boxed) uses white bars for pre-stimulus, grey bars for peri-stimulus and black bars for peri-stimulus duration where the spike frequency lies significantly above the spontaneous rate (two-way ANOVA, p < 0.05). (b(i)) The response (outlined) to a target starting 33° above the display base (pictogram, but note that target is not to scale), with its position-aligned control (from a) in grey. (ii) Response surrounding stimulus onset magnified. (iii) Normalized response, fitted with a logistic function (half-time = t50). (c) Response to a target starting 47° above the base. (d) Target starting 50° above the base. (e) Target starting 53° above the base. (f) Target starting 63° above the base.

