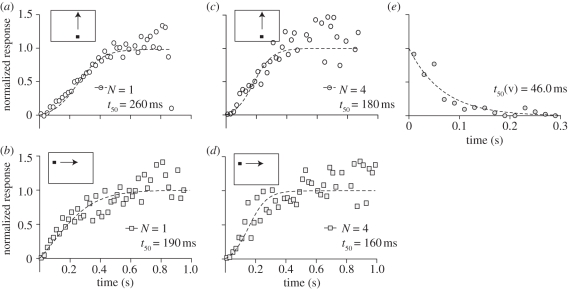
Figure 2.
Response half-times. (a) Normalized response time course averaged across all start positions (i.e. same data as in figure 1). (b) Normalized response onset from the same neuron, to targets drifting horizontally. (c) Response to vertical drifts, pooled across four neurons. (d) Response to horizontal target drifts, pooled across four neurons. (e) The normalized response decay when targets disappeared close to the hotspot (three different receptive field locations, N = 1, n = 39).

