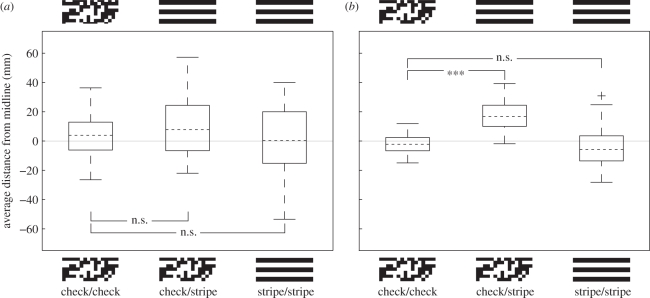
Figure 2.
The effect of changes in horizontal optic flow cues on centring in (a) M. genalis and in (b) B. terrestris. Thick black lines indicate the tunnel walls; light grey lines indicate the midline of the tunnel and the pattern (check or stripe) indicates the position of the patterns. Other details as in figure 1. In the check/stripe condition, bumble-bees fly closer to the stripe pattern; we see no such effect in Megalopta.

