Figure 1.
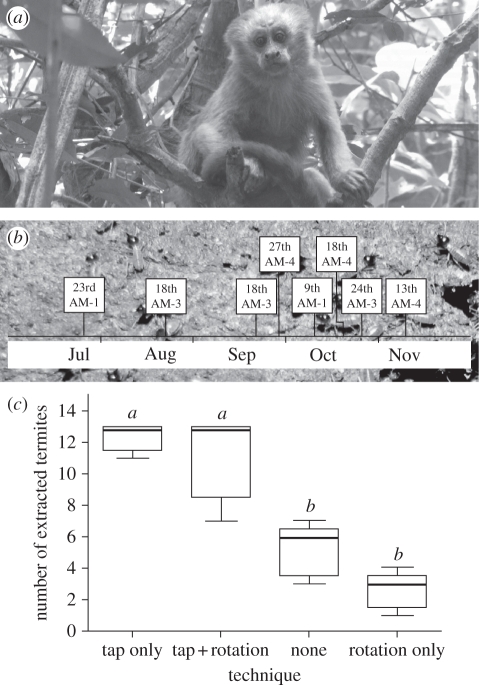
(a) A blonde capuchin (Cebus flavius) in the study site. (b) Distribution of termite fishing activity across the observational period (days and months are in italic; AM refers to ‘adult male’ and the number to its identity). Background image: Nasutitermes sp. (c) Tapping increased the rate of collection; rotation did not. The term ‘none’ means that the tapping and rotating techniques were not employed. Illustrated are medians and interquartile ranges. Statistics: Mann–Whitney U-test, adjusted via a sequential Bonferroni correction (tap only versus tap + rotation: U = 10.5, p = 0.7484a,a; tap only versus none: U = 0, p = 0.0079a,b; tap only versus rotation only: U = 0, p = 0.0079a,b; tap + rotation versus none: U = 0.5, p = 0.0162a,b; tap + rotation versus rotation only: U = 0, p = 0.0079a,b; none versus rotation only: U = 2.5, p = 0.0463b,b); n1 = n2 = 5 in all cases; after correction: different letters = p ≤ 0.05; similar letters = n.s.).

