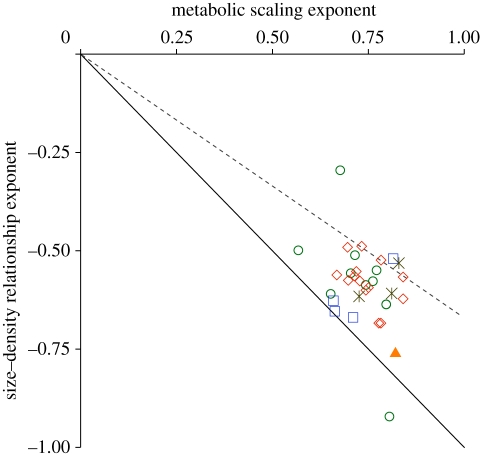
Figure 2.
Exponents of the SDR for 32 orders (y-axis), extracted from the best-fitting model, plotted against order-specific metabolic scaling exponents (x-axis). The solid and dashed lines indicate the expectation of the energetic equivalence rule in two- and three-dimensional foraging habitats, respectively. Green circles, mammals; red diamonds, birds; orange triangle, lizards; blue squares, fishes; black asterisks, invertebrates.

