Abstract
Histotripsy is a well-controlled ultrasonic tissue ablation technology that mechanically and progressively fractionates tissue structures using cavitation. The fractionated tissue volume can be monitored with ultrasound imaging because a significant ultrasound backscatter reduction occurs. This paper correlates the ultrasound backscatter reduction with the degree of tissue fractionation characterized by the percentage of remaining normal-appearing cell nuclei on histology. Different degrees of tissue fractionation were generated in vitro in freshly excised porcine kidneys by varying the number of therapeutic ultrasound pulses from 100 to 2000 pulses per treatment location. All ultrasound pulses were 15 cycles at 1 MHz delivered at 100 Hz pulse repetition frequency and 19 MPa peak negative pressure. The results showed that the normalized backscatter intensity decreased exponentially with increasing number of pulses. Correspondingly, the percentage of normal appearing nuclei in the treated area decreased exponentially as well. A linear correlation existed between the normalized backscatter intensity and the percentage of normal appearing cell nuclei in the treated region. This suggests that the normalized backscatter intensity may be a potential quantitative real-time feedback parameter for histotripsy-induced tissue fractionation. This quantitative feedback may allow the prediction of local clinical outcomes, i.e., when a tissue volume has been sufficiently treated.
I. Introduction
Focused ultrasound has been shown to induce tissue ablation through thermal or mechanical mechanisms [1]–[6]. Ultrasonic thermal therapy has been widely studied for the treatments including uterine fibroids and solid tumors [7]–[9]. In comparison, mechanical effects, mainly cavitational effects, have been avoided for tissue ablation because of the difficulty in controlling and predicting cavitational tissue damage. Our recent studies have demonstrated that cavitation can be controlled to achieve consistent soft tissue ablation using extremely short (<20 μs) and intense (>8 MPa) ultrasound pulses delivered at low duty cycles (<1%) [10]–[16]. With a sufficient number of successive pulses, the cavitation activities can completely fractionate tissue to a subcellular level, resulting in a highly disintegrated volume with sharply demarcated boundaries [13], [15]. The liquefied tissue volume can be reabsorbed by the body over time, leading to effective tissue removal [17]. This technology can be thought of as lithotripsy for soft tissue, thus giving rise to the name “histotripsy.” Histotripsy has potential for many clinical applications where noninvasive tissue removal is desired, such as treatment for an enlarged prostate clinically termed benign prostatic hyperplasia [18].
Imaging feedback of the tissue treatment effects is critical for noninvasive tissue ablation techniques. It allows the operating clinician to monitor the treatment progress and determine the endpoint of the treatment. To estimate tissue damage, several methods have been investigated for ultrasound thermal therapies. Magnetic resonance (MR) imaging has been shown to provide accurate estimation of the temperature change in the treated tissue [19]–[22]. The drawback of the magnetic resonance imaging is the relatively high cost and the requirement for an MR-compatible ultrasound system. Several ultrasound imaging methods have also been investigated to monitor the thermal tissue damage by measuring the changes in tissue elasticity, sound velocity, and acoustic attenuation [23]–[28]. These techniques are still in being researched for feasibility and efficacy.
In comparison, the fractionated tissue volume produced by histotripsy can be visualized clearly as a hypoechoic region using standard ultrasound B-mode imaging. This hypoechoic region implies significant reduction in ultrasound backscatter from the histotripsy-treated volume. The backscatter reduction can be seen in real-time during and immediately after the treatment. This phenomenon likely occurs because tissue is mechanically subdivided into small fragments that cannot effectively scatter ultrasound at the imaging frequency used [29]. Based on this finding, we hypothesize that ultrasound backscatter gradually decreases as histotripsy progressively fractionates the sources of ultrasound scattering in tissue. Therefore, the change in ultrasound backscatter may be used to quantitatively predict the degree of tissue fractionation in real time, i.e., the treatment effect and progression of histotripsy.
This paper studies the quantitative relationship between the ultrasound backscatter intensity and the degree of tissue fractionation. Each histotripsy pulse is hypothesized to fractionate a portion of tissue. An increasing number of successive histotripsy pulses can result in cumulative tissue fractionation. With a sufficient number of pulses, a tissue volume can be completely fractionated. Therefore, different degrees of tissue fractionation may be produced by varying the number of histotripsy pulses.
The degree of tissue fractionation is evaluated histologically by the percentage of intact cells remaining in the treatment volume. The intactness of a cell is determined by the appearance of its cell nucleus on histology. The cell nucleus is selected because it is a common indication of cell damage or death. More importantly, it has been observed to be more resistant to mechanical damage generated by histotripsy than other cellular components or organelles [30]. The quantitative correlation between the percentage of remaining normal appearing cell nuclei and backscatter intensity may provide the basis for a real-time image-based feedback metric for a histotripsy treatment, predicting a local clinical outcome.
II. Materials and Methods
A. Tissue Preparation
In vitro experiments were conducted in fresh porcine kidneys obtained from a local abattoir. The kidneys were preserved in degassed saline at room temperature and used within 6 h of harvest. The renal capsule was removed, and the collecting system of each kidney was flushed with degassed saline through the ureter to remove trapped air. More details of the kidney preparation process were described in our previous publication [31]. The flushed kidneys were then sealed in Ziploc bags filled with saline, mounted to a motorized 3-axis positioning system (Parker Hannifin, Rohnert Park, CA), and submerged in a tank of degassed, deionized water during experimentation.
B. Histotripsy Therapeutic Ultrasound
A 1-MHz annular array transducer (Imasonic, Besancon, France) was used to generate therapeutic ultrasound pulses. The transducer has a 100 mm outer diameter, a 40 mm inner diameter, and a 90 mm geometric focal length. The 16 annular elements were driven synchronously to work as a single element transducer focused at the geometric focus. The input electronic signals to the therapeutic ultrasound were delivered by a function generator (Model 3314A; Agilent Technology, Palo Alto, CA) and amplified by a custom-built driving circuit. The driving circuit shares similar design with our other transducer driving systems [32], [33].
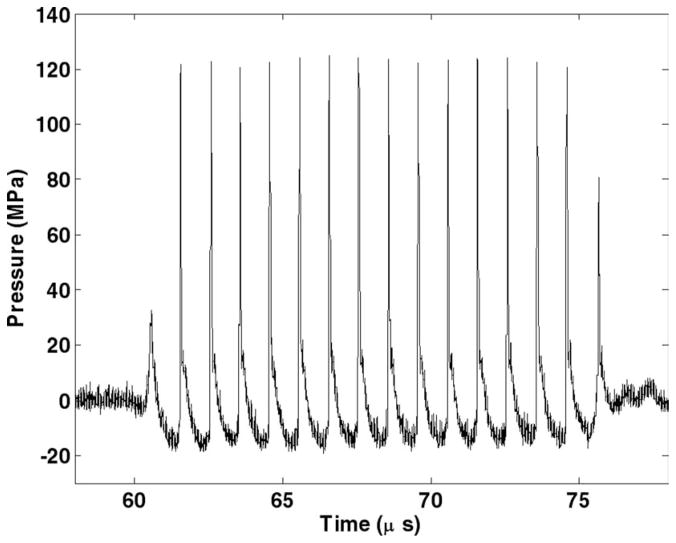
The acoustic field was calibrated in degassed water with a custom-built fiber optic hydrophone system with a 100 μm diameter sensitive element [34]. Ultrasound pulses of 15 acoustic cycles in duration delivered at a pulse repetition frequency (PRF) of 100 Hz were used in all treatments. The peak negative and positive pressures were measured to be 19 MPa and 125 MPa, respectively (Fig. 1). The −6 dB beamwidths were measured 1.9 mm laterally and 15 mm axially at 5 MPa peak negative pressure. The beamwidths decreased with increasing pressures. The beamwidths at the pressure used for tissue treatment could not be successfully measured because the high pressure would induce cavitation at the fiber tip within a few pulses. The fiber tip would be damaged after several cavitation events during the pressure profile scan. The spatial peak pulse average intensity (ISPPA) and the spatial average temporal average intensity (ISATA) were calculated from the free-field measurements using the definitions described by the American Institute of Ultrasound in Medicine [35]. The ISPPA was calculated to be 39 kW/cm2. The ISATA calculated based on the −6 dB cross-sectional beam area at 5 MPa was 27 W/cm2. The above measurements reported here were obtained under free-field conditions. Given the 1 dB/cm/MHz sound attenuation in the porcine kidney [36], a 1 cm mean path length in tissue and a 1 MHz center frequency, the peak negative pressure in tissue is likely 17 MPa. However, this calculation only accounts for the absorption of the fundamental harmonic but not that of the higher harmonics generated at high pressures due to the nonlinearity of the medium. These higher harmonics should attenuate faster than lower frequencies, resulting in a substantial decay of the positive pressures.
Fig. 1.
15-cycle pulse at 1 MHz measured in water with a fiber optic hydrophone system.
C. Ultrasound Image Guidance for Histotripsy Treatment
The histotripsy treatment consisted of 3 general steps, all of which were guided by ultrasound imaging. First, the therapy focus was localized to the targeted tissue region before the treatment. Histotripsy pulses were used to create a bubble cloud in water, which appeared as a hyper-echoic zone on the ultrasound image and was marked as the therapy focus; see Fig. 2(a). Targeting was achieved by aligning the focus marker to the tissue to be treated on ultrasound image; see Fig. 2(b). A small number of histotripsy pulses (<100 pulses) at the treatment pressure level were applied again to generate a bubble cloud in the tissue to verify the targeting accuracy; see Fig. 2(c). The number of targeting pulses is small compared with the lowest dose (2700 pulses/lesion) for tissue treatment. No significant tissue damage was generated by this targeting procedure alone on histology. Second, histotripsy treatment was applied. The treatment was monitored by observing the actively cavitating bubble clouds, which appeared as a dynamically changing hyperechoic region on ultrasound images. Third, the treatment was completed when the designated number of pulses was achieved in the target volume.
Fig. 2.
Ultrasound imaging of targeting and monitoring of histotripsy treatment using the 5 MHz imaging probe. Therapeutic ultrasound propagated from top to bottom of the images. (a) Prior to the treatment, a bubble cloud was generated in water and seen on ultrasound image as a hyperechoic region, which was marked as the treatment focus (“X”). (b) The focus marker was aligned with the targeted volume in the kidney on a pretreatment ultrasound image. (c) A bubble cloud was generated in the target volume to verify the target accuracy.
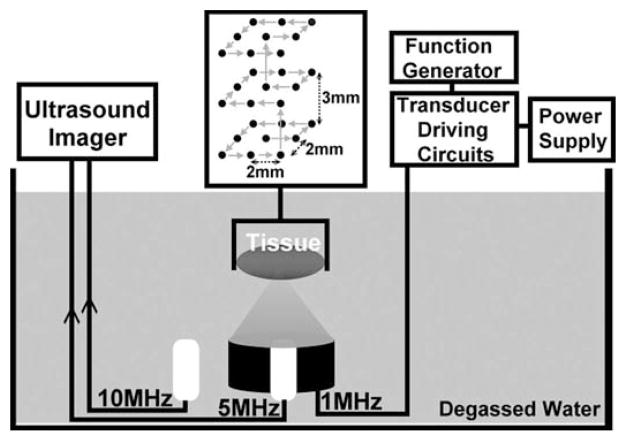
Ultrasound imaging of the treatment plane was achieved using 2 imaging probes, a 5-MHz phased array and a 10-MHz linear array, both used with a clinical diagnostic ultrasound system (GE System Five, Milwaukee, WI). The 5-MHz probe has 96 elements and an aperture size of 14 mm, focused 8 cm at the targeted tissue region. The 5-MHz imaging probe was used for target localization and monitoring of the treatment. It ensured that the bubble cloud activity occurred within the targeted volume and that the lesions were successfully generated. It was inserted in the center hole of the therapy transducer and imaged the therapy plane during the treatment using unsynchronized real-time B-mode imaging. The cloud activity and lesion formation could be clearly visualized using unsynchronized B-mode imaging because the therapy pulses were so short that only a few scan lines were corrupted with the interference from the therapy pulse; e.g., the radial lines in Fig. 2(c). The 10-MHz imaging probe was used to collect higher-resolution backscatter signals before and immediately after the treatment. The 10-MHz probe has 64 elements, a full array size of 44 mm, and an aperture size of 9.3 mm. It was positioned close to the tissue (3 cm from the tissue surface) and focused at 4 cm in the targeted treatment volume. The positions of the 2 imaging probes and the therapy transducer with respect to the tissue are illustrated in Fig. 3. The tissue was moved to be scanned by the 10-MHz imaging probe before and immediately after treatments according to a predetermined displacement. To measure the displacement between the imaging planes of the 2 probes, 2 crossed wires, one along the lateral axis and the other along the elevational axis of the imaging probes, were mounted to the positioning system and placed where the kidney would be in Fig. 3. The relative displacement of the positions at which the wire intersection appeared in the centers of the 2 imaging planes was determined as the displacement of the 2 imaging probes. Standard ultrasound B-scan IQ image frames were collected from the 10 MHz imaging probe and stored in the built-in EchoPac (GE Healthcare, Chalfont St. Giles, UK) image archive system for later processing. The transmit power and receive gain of the imaging system were adjusted for clear visualization of the kidney cortex and remained unchanged during the experiments. This setup permitted comparisons between pre- and post-treatment ultrasound backscatter intensity.
Fig. 3.
Experimental setup of histotripsy treatments in vitro. The tissue is mounted to a 3-D positioning system and moved to be scanned with histotripsy pulses along a 3 × 3 × 3 scanning grid. Each treatment location in this grid is exposed to 100, 300, 500, 700, 1000, 1500, or 2000 pulses to produce different degrees of tissue fractionation.
D. Histotripsy Treatment Plan
Lesions of approximately 6 × 6 × 15 mm each were generated by mechanically scanning the therapy focus in a 3 × 3 × 3 grid spaced 2 mm laterally and 3 mm axially (Fig. 3). To produce different degrees of tissue fractionation, lesions were created with different numbers of ultrasound pulses. The number of pulses applied, the delivered energy, the treatment time, and the sample size are listed in Table I.
TABLE I.
Ultrasound Treatment Parameters for Each Treatment Location or Each lesion.
| Each treatment location
|
Each lesion (volume ~0.5 cm3)
|
Sample size | |||
|---|---|---|---|---|---|
| # of pulses | Treatment time (s) | Delivered energy (J)* | Total treatment time | Total delivered energy (J)** | |
| 0 | 0 | 0 | 0 | 0 | 9 |
| 100 | 1 | 0.8 | 27 s | 20.7 | 6 |
| 300 | 3 | 2.3 | 1.4 min | 62.0 | 6 |
| 500 | 5 | 3.8 | 2.3 min | 103.3 | 6 |
| 700 | 7 | 5.4 | 3.2 min | 144.7 | 6 |
| 1000 | 10 | 7.7 | 4.5 min | 206.7 | 9 |
| 1500 | 15 | 11.5 | 6.8 min | 310.0 | 7 |
| 2000 | 20 | 15.3 | 9 min | 413.4 | 6 |
The delivered energy per treatment location is calculated as ISATA × ABCS × T where ABCS is the −6 dB beam cross-sectional area measured in free field, and T is the treatment time per treatment location.
The total delivered energy for each lesion is calculated as (Delivered energy to each treatment location) × (Total number of treatment locations).
E. Ultrasound Backscatter Intensity Analysis
The ultrasound backscatter was collected from a 4 × 6 mm region-of-interest (ROI) from an imaging plane centered in the planned treatment volume before and immediately after the treatment. The size of the ROI was chosen to be the same as the treatment grid so that the ROI covered the majority of the lesion. This selection of ROI ensured that the signals collected for backscatter analysis were from the treated tissue and not interfered with those from the untreated tissue. To quantitatively compare backscatter change across treatments, normalized backscatter intensity was calculated as follows. The backscatter intensity of a lesion was defined as the median backscatter intensity in a ROI within the lesion. The median backscatter intensities before and after treatment were calculated for each lesion. Normalized backscatter intensity of the lesion was estimated as the ratio of the posttreatment to the pretreatment backscatter intensity.
In 22 of 58 lesions, some small hyperechoic regions appear within the treatment volume on the posttreatment ultrasound images. These hyperechoic regions are assumed to be air bubbles generated during treatment, and they persisted for minutes after treatment. In most lesions, the area occupied by the bubbles was small and easily identified, because its echogenicity was 15 dB higher than that of the untreated tissue. The pixels in the bubble regions were excluded by manual segmentation for backscatter intensity analysis. In 3 lesions, however, the hyperechoic area occupied by the bubbles was too large. Excluding the pixels in the hyperechoic regions would affect the statistical significance for backscatter intensity analysis. These 3 lesions were therefore excluded for data analysis.
F. Degree of Tissue Fractionation Assessment
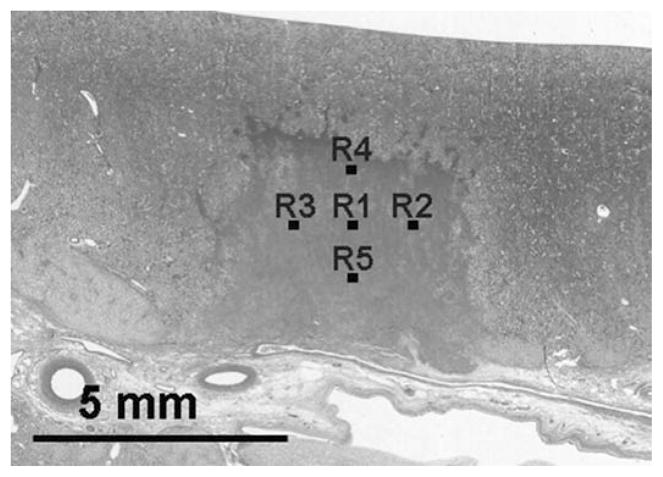
The hematoxylin and eosin (H&E) staining was used here for histological assessment of tissue fractionation based on its separable staining of nucleic and cytoplasmic components. Treated kidneys were fixed in 10% neutral buffered formalin and processed for H&E staining. Histological sections of 5 μm thickness were made at 500 μm intervals through the tissue with slices oriented in parallel with the ultrasound imaging plane. The H&E slides were examined under a bright-field optical microscope (Galen III, Leica Microsysems, Bannockburn, IL). Slide images were captured with a digital microscope camera (ProgRes C10plus, JENOPTIK Laser, Optik Systeme GmbH, Jena, Germany) connected to the microscope. Five 320 × 240 μm regions were imaged at a 400× magnification in a treated area. Locations of these 5 regions were selected to form a grid pattern with a 1 mm spacing as shown in Fig. 4. As a control, 5 regions with the same size, magnification, and spacing were imaged in an untreated area.
Fig. 4.
The homogeneous area in the center of the histology image indicates a lesion generated by histotripsy. Five regions (R1–R5) in the lesion were selected to examine the percentage of normal-appearing cell nuclei in the treated volume. The numbers of normal-appearing cell nuclei in each image were counted. The means and standard deviations of nuclei count from these 5 regions were calculated.
The degree of tissue fractionation was quantified by the percentage of normal-appearing cell nuclei remaining in the treated area in comparison to the untreated area. The number of normal-appearing nuclei was counted in the 5 regions in the treated area indicated in Fig. 4 as well as in the untreated area. The 5 counts were then averaged to obtain a representative nuclei count. The percentage of the remaining normal-appearing nuclei was calculated by dividing the average nuclei count in the treated area by that in the untreated area:
The percentage of remaining normal-appearing nuclei was therefore used as an indication of the degree of tissue fractionation.
III. Results
A total of 58 lesions were produced in 9 porcine kidneys using 7 different numbers of therapeutic ultrasound pulses per treatment location as given in Table I. Results collected from 55 of 58 lesions were included for our data analysis, resulting in a sample size of 6 to 9 for each number of pulses. Data from 3 out of the 58 treatments were excluded because of a relatively large number of bubbles persisting in the lesions after treatment, interfering significantly with the backscatter analysis.
A. Ultrasound Backscatter Intensity Analysis
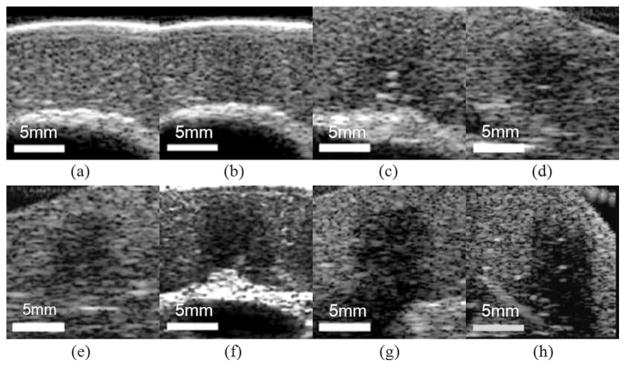
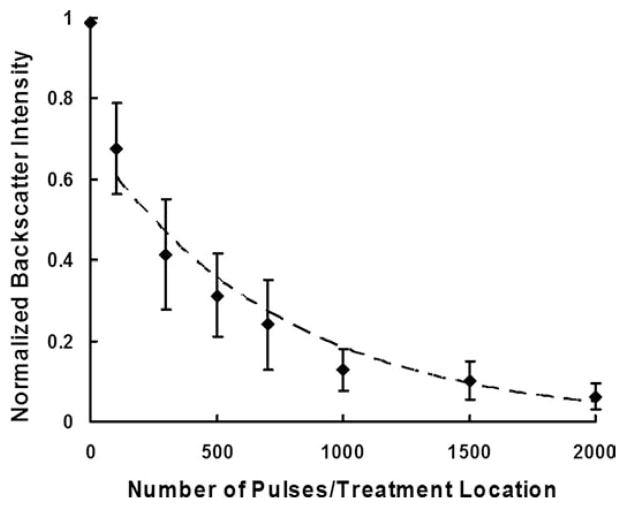
Within the treated area, a localized hypoechoic zone was discernable for all the different numbers of pulses used (Fig. 5). Furthermore, for all of the different pulse numbers tested, Student’s t-tests performed on the treated vs. untreated areas indicated a significant (P < 0.001) decrease in the normalized backscatter intensity in the treated area. The normalized backscatter intensity decreased with increasing number of pulses (Fig. 6). For example, the normalized backscatter intensity decreased to 0.7 when 100 pulses per treatment location were delivered, and 0.1 when 2000 pulses per treatment location were delivered. Regression analysis showed that the normalized backscatter intensity decreased exponentially as the number of pulses increased (R2 = 0.94).
Fig. 5.
B-mode images of different lesions generated with increasing numbers of pulses: (a) control (b) 100, (c) 300, (d) 500, (e) 700, (f) 1000, (g) 1500, and (h) 2000 pulses/treatment location. A progressive decrease in backscatter intensity is observed.
Fig. 6.
Normalized backscatter intensity as a function of number of pulses/treatment location. Data points are expressed in mean ± standard deviation (N = 6–9). The normalized backscatter intensity decreases exponentially as the number of pulses increases (Dashed line: y = 0.69e−0.001x, R2 = 0.94).
B. Degree of Tissue Fractionation Assessment
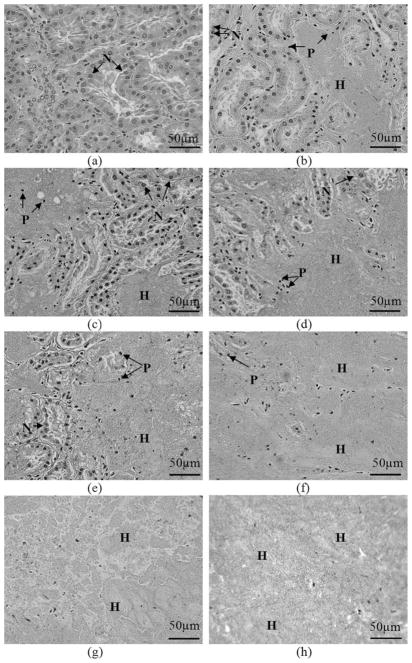
Fig. 7 illustrates representative H&E slide images of targeted volumes of porcine kidney tissue treated with various numbers of pulses. In an untreated area, all cell nuclei appear normal. In treated areas, cell morphology varied significantly: cells with normal-appearing, pyknotic, and/or complete absence of cell nuclei were present. With the lowest number of pulses (e.g., 100 to 300 pulses per treatment location), subvolumes of acellular debris and disrupted cellular structures were observed in the midst of largely unfractionated tissue within a treated area. As the numbers of pulses increased (e.g., 300 to 1000 pulses per treatment location), the subvolume of homogenate was enlarged, resulting in the homogenate surrounding small islands of unfractionated tissue. At the highest pulse numbers (e.g., 1500 to 2000 pulses per treatment location), the treated area was completely fractionated, with no or very few recognizable cellular structures. Immediately surrounding the lesions was a 10 to 100 μm transition zone of cells with pyknotic or absent cell nuclei. The tissue outside the transition zone appeared histologically intact.
Fig. 7.
H&E stained lesions show progressive tissue fractionation generated with increasing numbers of pulses. In the control (untreated) slide, all cell nuclei appear normal. Following application of histotripsy treatment, the number of normal-appearing cell nuclei (N) decreases significantly, and pyknotic cell nuclei (P) are apparent. Subvolumes of homogenized tissue debris (H) exist in all treated tissues. Larger subvolumes of homogenate are observed as the number of pulses increases; (a) control; (b)–(h) increasing numbers of pulses/treatment location: (b) 100, (c) 300, (d) 500, (e) 700, (f) 1000, (g) 1500, (h) 2000.
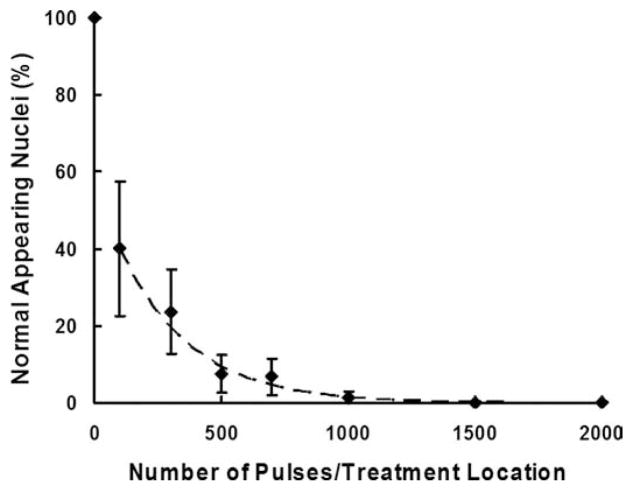
Quantitative tissue damage was assessed by evaluating the percentage of remaining normal-appearing cell nuclei. This percentage decreased with increasing number of pulses, indicating the increasing degree of tissue fractionation (Fig. 8). The remaining normal-appearing nuclei decreased substantially to approximately 40% at the lowest number of pulses tested (100 pulses per treatment location) when compared with the untreated areas and further reduced to nearly zero at 1000 pulses per treatment location and above. Regression analysis showed that this decrease in the percentage of remaining nuclei followed an exponential trend (R2 = 0.97).
Fig. 8.
Percentages of normal-appearing nuclei plotted as functions of the number of treatment pulses. Data are expressed in mean ± standard deviation (N = 6–9). The percentage of normal-appearing cell nuclei decreases exponentially as the number of pulses increases (Dashed line: y = 57.9e−0.004x, R2 = 0.97).
C. Correlation Between Backscatter Intensity and Degree of Tissue Fractionation
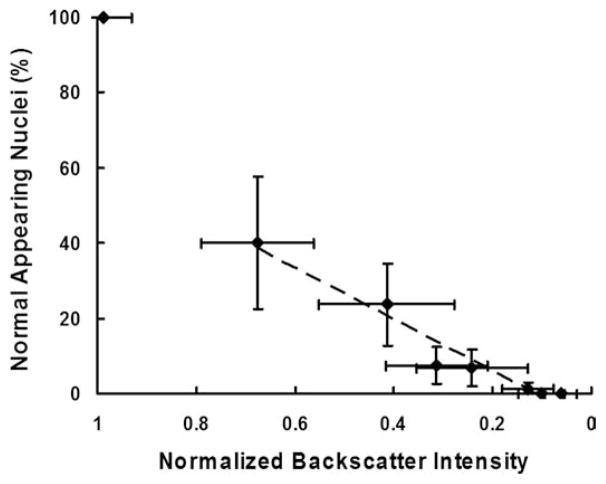
Qualitatively, more severe histological tissue damage corresponded to lower normalized ultrasound backscatter intensity. The size and shape of the lesion on H&E slides matched those of the hypoechoic area on ultrasound images. Quantitatively, the normalized backscatter intensity was correlated to the degree of tissue fractionation, indicated by the percentage of the remaining normal appearing nuclei (Fig. 9). The normalized backscatter intensity decreased significantly (from 1.0 to 0.7) at the beginning of the treatment progression when the percentage of remaining normal-appearing nuclei dropped from 100% to 40%. As the percentage of normal-appearing nuclei approached zero, the normalized backscatter intensity decreased to nearly 0.1. The percentage of the remaining normal-appearing nuclei decayed linearly as the normalized backscatter intensity decreased. A strong correlation between the percentage of the normal-appearing nuclei and the normalized backscatter intensity was found by regression analysis (R2 = 0.95).
Fig. 9.
Percentages of normal-appearing nuclei plotted as functions of the normalized backscatter intensity. Data are expressed in mean ± standard deviation (N = 6–9). A strong linear correlation is found between the percentage of normal-appearing cell nuclei and the normalized backscatter intensity (Dashed line: y = 68.2x −7.5, R2 = 0.95). The data point from the untreated tissue (control, normal-appearing nuclei = 100%, normalized backscatter intensity = 1.0) is excluded for the regression analysis.
IV. Discussion
We have shown a strong correlation between the normalized backscatter intensity and the percentage of the remaining normal-appearing nuclei, i.e., the degree of tissue fractionation. This correlation established an important link between an easily obtained image parameter and physical tissue damage. Based on the correlation, we may predict the degree of tissue fractionation in the treated area using ultrasound imaging. The ultrasound backscatter data can be collected, not only immediately after treatment, but also during the treatment. At the very least, the therapy pulses may be temporarily stopped for real-time imaging of the treated tissue. The tissue fractionation process can be resumed when the therapy pulses are applied again. More advanced signal processing may allow tissue assessment while the therapy continues. Because the ultrasound backscatter can be collected immediately after the treatment, the backscatter reduction may be an image-based feedback parameter that would allow a clinician to determine when sufficient treatment has occurred.
A threshold value of the normalized backscatter intensity indicative of sufficient treatment may be inferred from the correlation between the percentage of remaining intact nuclei and the normalized backscatter intensity. For any treatment that requires complete tissue removal, such as tumor ablation, a zero survival rate is desired. According to the present study, a normalized backscatter intensity of 0.1 corresponds to zero normal-appearing cell nuclei remaining in the target volume. Therefore, a normalized backscatter intensity below 0.1 may inform sufficient treatment. However, this value may be a threshold beyond that required for cell death because the cell death is strictly determined by the morphological change of the cell nucleus. In fact, the cells may be irreversibly damaged to the point of eventual cell death while the cell nuclei temporarily remain morphologically intact. A comprehensive evaluation on the cell or tissue damage and in vivo chronic studies are necessary to establish a proper threshold for sufficient treatment. Although cell nuclei were used here as an indication of tissue fractionation and a source of acoustic backscatter, we plan to investigate other cellular components (e.g., cell membrane) in the future.
Bubbles generated by histotripsy may persist for minutes after the treatment. These bubbles result in hyperechoic regions in the treated volume and are the main interference with the evaluation of backscatter intensity. However, this complication occurred in only 3 of 58 lesions produced, and signal-processing methods may be able to discriminate bubble signals from that of the underlying tissue structure. Further investigation into acoustic techniques for resolving this issue is currently being pursued.
The calculation of the normalized backscatter intensity relies on accurate alignment of the B-mode images before and after treatment. In the ex vivo setup, tissue is mounted to the positioning system, and the alignment of images before and after treatment can be achieved easily. In a clinical setting, patients may move during the treatment, which may affect the backscatter analysis. To address this issue, we can identify several reference points on the ultrasound image before the treatment. After the treatment, the imaging plane can be reproduced by moving the imaging probe to the plane defined by these reference points. Alternatively and in case of any deformation, the pretreatment and posttreatment images could be registered by aligning the reference points on the 2 images using image registration algorithms [37], [38]. The backscatter intensity analysis can then be performed in the treatment area on the 2 registered images.
Significant ultrasound backscatter reduction is observed in a highly localized area treated by histotripsy. Ultrasound backscatter is the acoustic waves reflecting off inhomogeneities in the propagation medium [39]. In biological tissue, the inhomogeneities result from the discontinuities in the acoustic impedance among various tissue microstructures. The literature has identified several possible sources of ultrasonic scattering, including the cell nuclei, collagen, extracellular matrix, or functional tissue elements such as the glomerulus or renal tubules [40]–[46]. Our histological observations of a completely fractionated tissue showed that very few, if any, of the above scattering structures persisted in the local area completely fractionated by histotripsy. Therefore, the backscatter reduction may occur because the histotripsy pulses mechanically break down the arrangement of tissue structure, resulting in a more homogeneous volume with reduced scatter cross section.
The linear relationship found in the present work between the normalized backscatter intensity and the percentage of normal-appearing cell nuclei is consistent with the trend predicted from the model of incoherent scattering. One possible explanation is that the cell nuclei might be an important source of sound scattering in tissue. This explanation is suggested because 1) the average size (8 μm) of the cell nucleus is much smaller than the acoustic wavelength of the imaging probe used to collect backscatter signals (150 μm), and 2) the mechanical properties of the cell nuclei are similar to those of the surrounding medium [47]. Thus, weak scattering waves are emitted from individual cell nuclei. Under such conditions, the scattered waves from the cell nuclei can be assumed to cause mostly incoherent scattering. The theoretical model predicts backscatter intensity from incoherent scattering to be linearly proportional to the concentration of scatterers [48], which may explain the linear correlation found in this study. It is worth noting that this model assumes a sparse population of scatterers. Modification is needed for a dense medium, such as an untreated tissue that contains multiple types of sound scattering structures, because of a more complicated scattering environment and correspondingly different backscattered fields [49]–[52]. A different trend of backscatter intensity change may be found for untreated or less fractionated tissues. This is probably why the control data point in Fig. 9 deviated from the linear fit between the percentage of the cell nuclei and the normalized backscatter intensity. Despite the fact that the incoherent scattering from the cell nuclei could well explain the results, it is also likely that the cell nuclei are just a good indicator of the intact structures responsible for sound scattering.
The median backscatter intensity is used as the first metric for the evaluation of the degree of tissue fractionation. However, higher order statistics can be applied to predict more details on the structural change in tissue. For example, the ultrasound backscatter power spectrum parameters have been shown theoretically and experimentally indicative of the size, shape, and concentration of the acoustic scatterers in biological tissues [50]–[54]. The feasibility of using these higher order statistics to predict the degree of tissue fractionation in histotripsy will be investigated in the future.
V. Conclusions
Histotripsy progressively and mechanically fractionates tissue using cavitation. With a sufficient number of pulses, it can completely fractionate tissue to acellular debris. Significant reduction in ultrasound backscatter intensity occurs in the treated tissue volume immediately after the treatment. Normalized ultrasound backscatter intensity is quantitatively correlated with the percentage of normal-appearing cell nuclei, i.e., the degree of tissue fractionation. Because tissue fractionation should be related to the cell death or some other clinical outcomes, we believe that the normalized ultrasound backscatter intensity has the potential to be a real-time feedback parameter for histotripsy that allows the prediction of local clinical outcomes, i.e., when a tissue volume has been sufficiently treated. Such a feedback metric is highly desirable, if not essential, for any noninvasive surgical procedure.
Acknowledgments
The authors would like to thank C. Edwards, S. Almburg, and D. Sorenson of the Microscopy and Image Analysis Laboratory at the University of Michigan for the assistance in histological slide imaging.
Biographies

Tzu-Yin Wang is a graduate student in the Department of Biomedical Engineering at the University of Michigan, Ann Arbor, MI. She received her B.S. degree in 2004 and M.S. degree in 2006, both in electrical engineering from National Tai-wan University, Taipei, Taiwan. Her research interests include image feedback for ultrasound therapy, mechanisms of cavitational tissue fractionation, and phased-array ultrasound transducers for therapeutics.

Zhen Xu (S’04–M’05) is currently an assistant research scientist in the Department of Biomedical Engineering at the University of Michigan, Ann Arbor, MI. Her research interests include applications of high-intensity ultrasound for noninvasive surgeries and drug delivery, effects of cavitation in therapeutic ultrasound, and phased-array ultrasound transducers for therapeutics. Dr. Xu received her B.S.E. (highest honors) degree from Southeast University, Nanjing, China, in 2001, and her M.S. and Ph.D. degrees from the University of Michigan in 2003 and 2005, respectively, both in biomedical engineering.

Frank Winterroth is a graduate student in the Department of Biomedical Engineering at the University of Michigan, Ann Arbor. He received his B.A. degree in biology from the University of California, Santa Cruz, and his M.S. degree in biomedical engineering from California Polytechnic State University, San Luis Obispo. His research interests include image feedback for scanning acoustic microscopy and nonlinear elastic properties of natural and engineered tissues.
Timothy L. Hall was born in 1975 in Lansing, MI. He is currently a research fellow in the Department of Radiology at the University of Michigan. He received the B.S.E. degree in 1998 and M.S.E. degree in 2001, both in electrical engineering, and he received his Ph.D. degree in 2007 in biomedical engineering, all from the University of Michigan. He worked for Teradyne Inc., Boston, MA, from 1998 to 1999 as a circuit design engineer and at the University of Michigan from 2001 to 2004 as a visiting research investigator. His research interests are in high-power pulsed-RF-amplifier electronics, phased-array ultrasound transducers for therapeutics, and sonic cavitation for therapeutic applications.

Jeffery Brian Fowlkes (M’94–A’94) is an associate professor in the Department of Radiology and associate professor in the Department of Biomedical Engineering at the University of Michigan, Ann Arbor, MI. He is currently directing and conducting research in medical ultrasound, including the use of gas bubbles for diagnostic and therapeutic applications. His work includes studies of ultrasound contrast agents for monitoring tissue perfusion, acoustic droplet vaporization for bubble production in cancer therapy and phase aberration correction, effects of gas bubbles in high-intensity ultrasound, and volume flow estimation for ultrasonic imaging. Dr. Fowlkes received his B.S. degree in physics from the University of Central Arkansas in 1983, and his M.S. and Ph.D. degrees from the University of Mississippi in 1986 and 1988, respectively, both in physics. Dr. Fowlkes is a fellow of the American Institute of Ultrasound in Medicine and has served as secretary and as a member of its Board of Governors. He also received the AIUM Presidential Recognition Award for outstanding contributions and service to the expanding future of ultrasound in medicine. As a member of the Acoustical Society of America, Dr. Fowlkes has served on the Physical Acoustics Technical Committee and the Medical Acoustics and Bioresponse to Vibration Technical Committee. As a member of the IEEE, he has worked with the IEEE I&M Society Technical Committee on Imaging Systems. Dr. Fowlkes is a fellow of the American Institute of Medical and Biomedical Engineering.

Edward D. Rothman is a professor in the Department of Statistics at the University of Michigan. He received a B.S. degree in mathematics (first class) from McGill University, Montreal, Quebec, Canada, in 1965, and a Ph.D. degree in statistics from Johns Hopkins University, Baltimore, MD, in 1969. His research interests are biological and legal applications, nonparametric regression, and quality control.

William Woodruff Roberts was born in Charlottesville, VA, on July 26, 1970. He received his B.S. degree in physics from Massachusetts Institute of Technology, Cambridge, MA, in 1992 and his M.D. degree from Johns Hopkins University, Baltimore, MD, in 1997.
From 1997 to 2003, he pursued residency training in general surgery and urology at the Brady Urological Institute, Johns Hopkins Hospital, Baltimore, MD, and was appointed an instructor in urology in 2003. He joined the faculty at the University of Michigan in 2004 and is currently an assistant professor in the Department of Urology and assistant professor in the Department of Biomedical Engineering, University of Michigan, Ann Arbor, MI. He was certified by the American Board of Urology in 2006.
Dr. Roberts maintains a busy clinical practice focused on laparoscopy, endourology, and minimally invasive treatment of cancer and stone disease. His research is focused on the preclinical development and clinical application of focused ultrasound as an alternative to surgical and percutaneous interventions.
Charles A. Cain (S’65–M’71–SM’80–F’89) was born in Tampa, FL, on March 3, 1943. He received the B.E.E. (highest honors) degree in 1965 from the University of Florida, Gainesville, FL; the M.S.E.E. degree in 1966 from Massachusetts Institute of Technology, Cambridge, MA; and the Ph.D. degree in electrical engineering in 1972 from the University of Michigan, Ann Arbor, MI. During 1965 through 1968, he was a member of the Technical Staff at Bell Laboratories, Naperville, IL, where he worked in the electronic switching systems development area.
During 1972 through 1989, he was in the Department of Electrical and Computer Engineering at the University of Illinois at Urbana-Champaign, where he was a professor of electrical engineering and bioengineering. Since 1989, he has been in the College of Engineering at the University of Michigan, Ann Arbor, as a professor of biomedical engineering and electrical engineering. He was the chair of the Biomedical Engineering Program from 1989 to 1996; the founding chair of the Biomedical Engineering Department from 1996 to 1999; and the Richard A. Auhll Professor of Engineering in 2002.
He has been involved in research on the medical applications of ultrasound, particularly high-intensity ultrasound for noninvasive surgery. He was formerly an associate editor of the IEEE Transactions on Biomedical Engineering and the IEEE Transactions on Ultrasonics, Ferroelectrics, and Frequency Control and an editorial board member of the International Journal of Hyperthermia and Radiation Research. He is a fellow of the IEEE and the AIMBE.
Contributor Information
Tzu-Yin Wang, Email: tzuyin@umich.edu, Department of Biomedical Engineering, University of Michigan, Ann Arbor, MI.
Zhen Xu, Department of Biomedical Engineering, University of Michigan, Ann Arbor, MI.
Frank Winterroth, Department of Biomedical Engineering, University of Michigan, Ann Arbor, MI.
Timothy L. Hall, Department of Urology, University of Michigan, Ann Arbor, MI
J. Brian Fowlkes, Departments of Radiology and Biomedical Engineering, University of Michigan, Ann Arbor, MI.
Edward D. Rothman, Department of Statistics, University of Michigan, Ann Arbor, MI
William W. Roberts, Department of Urology, University of Michigan, Ann Arbor, MI
Charles A. Cain, Departments of Biomedical Engineering and Electrical Engineering and Computer Science, University of Michigan, Ann Arbor, MI.
References
- 1.Fry FJ, Kossoff G, Eggleton RC, Dunn F. Threshold ultrasonic dosages for structural changes in the mammalian brain. J Acoust Soc Am. 1970 Dec;48:1413–1417. doi: 10.1121/1.1912301. [DOI] [PubMed] [Google Scholar]
- 2.Frizzell LA, Lee CS, Aschenbach PD, Borrelli MJ, Morimoto RS, Dunn F. Involvement of ultrasonically induced cavitation in the production of hind limb paralysis of the mouse neonate. J Acoust Soc Am. 1983 Sep;74:1062–1065. doi: 10.1121/1.389941. [DOI] [PubMed] [Google Scholar]
- 3.Chapelon JY, Prat F, Delon C, Margonari J, Gelet A, Blanc E. Effects of cavitation in the high intensity therapeutic ultrasound,” in. Proc IEEE Ultrasonics Symp. 1991:1357–1360. [Google Scholar]
- 4.Hynynen K. The threshold for thermally significant cavitation in dog’s thigh muscle in vivo. Ultrasound Med Biol. 1991;17(2):157–169. doi: 10.1016/0301-5629(91)90123-e. [DOI] [PubMed] [Google Scholar]
- 5.Prat F, Chapelon JY, Abou el Fadil F, Sibille A, Theilliere Y, Ponchon T, Cathignol D. Focused liver ablation by cavitation in the rabbit: A potential new method of extracorporeal treatment. Gut. 1994 Mar;35:395–400. doi: 10.1136/gut.35.3.395. [DOI] [PMC free article] [PubMed] [Google Scholar]
- 6.Fry FJ, Sanghvi NT, Foster RS, Bihrle R, Hennige C. Ultrasound and microbubbles: Their generation, detection and potential utilization in tissue and organ therapy–Experimental. Ultrasound Med Biol. 1995;21(9):1227–1237. doi: 10.1016/0301-5629(96)89519-6. [DOI] [PubMed] [Google Scholar]
- 7.Illing RO, Kennedy JE, Wu F, ter Haar GR, Protheroe AS, Friend PJ, Gleeson FV, Cranston DW, Phillips RR, Middleton MR. The safety and feasibility of extracorporeal high-intensity focused ultrasound (HIFU) for the treatment of liver and kidney tumours in a Western population. Br J Cancer. 2005 Oct;93:890–895. doi: 10.1038/sj.bjc.6602803. [DOI] [PMC free article] [PubMed] [Google Scholar]
- 8.Kennedy JE, Wu F, ter Haar GR, Gleeson FV, Phillips RR, Middleton MR, Cranston D. High-intensity focused ultrasound for the treatment of liver tumours. Ultrasonics. 2004 Apr;42:931–935. doi: 10.1016/j.ultras.2004.01.089. [DOI] [PubMed] [Google Scholar]
- 9.Wu F, Wang ZB, Cao YD, Chen WZ, Bai J, Zou JZ, Zhu H. A randomised clinical trial of high-intensity focused ultrasound ablation for the treatment of patients with localised breast cancer. Br J Cancer. 2003 Dec;89:2227–2233. doi: 10.1038/sj.bjc.6601411. [DOI] [PMC free article] [PubMed] [Google Scholar]
- 10.Xu Z, Ludomirsky A, Eun LY, Hall TL, Tran BC, Fowlkes JB, Cain CA. Controlled ultrasound tissue erosion. IEEE Trans Ultrason Ferroelectr Freq Control. 2004 Jun;51:726–736. doi: 10.1109/tuffc.2004.1308731. [DOI] [PMC free article] [PubMed] [Google Scholar]
- 11.Xu Z, Fowlkes JB, Ludomirsky A, Cain CA. Investigation of intensity thresholds for ultrasound tissue erosion. Ultrasound Med Biol. 2005 Dec;31:1673–1682. doi: 10.1016/j.ultrasmedbio.2005.07.016. [DOI] [PMC free article] [PubMed] [Google Scholar]
- 12.Xu Z, Fowlkes JB, Rothman ED, Levin AM, Cain CA. Controlled ultrasound tissue erosion: The role of dynamic interaction between insonation and microbubble activity. J Acoust Soc Am. 2005 Jan;117:424–435. doi: 10.1121/1.1828551. [DOI] [PMC free article] [PubMed] [Google Scholar]
- 13.Parsons JE, Cain CA, Abrams GD, Fowlkes JB. Pulsed cavitational ultrasound therapy for controlled tissue homogenization. Ultrasound Med Biol. 2006 Jan;32:115–129. doi: 10.1016/j.ultrasmedbio.2005.09.005. [DOI] [PubMed] [Google Scholar]
- 14.Xu Z, Fowlkes JB, Cain CA. A new strategy to enhance cavitational tissue erosion using a high-intensity, initiating sequence. IEEE Trans Ultrason Ferroelectr Freq Control. 2006 Aug;53:1412–1424. doi: 10.1109/tuffc.2006.1665098. [DOI] [PMC free article] [PubMed] [Google Scholar]
- 15.Roberts WW, Hall TL, Ives K, Wolf JS, Jr, Fowlkes JB, Cain CA. Pulsed cavitational ultrasound: A noninvasive technology for controlled tissue ablation (histotripsy) in the rabbit kidney. J Urol. 2006 Feb;175:734–738. doi: 10.1016/S0022-5347(05)00141-2. [DOI] [PubMed] [Google Scholar]
- 16.Xu Z, Hall TL, Fowlkes JB, Cain CA. Effects of acoustic parameters on bubble cloud dynamics in ultrasound tissue erosion (histotripsy) J Acoust Soc Am. 2007 Jul;122:229–236. doi: 10.1121/1.2735110. [DOI] [PMC free article] [PubMed] [Google Scholar]
- 17.Hall TL, Kieran K, Ives K, Fowlkes JB, Cain CA, Roberts WW. Histotripsy of rabbit renal tissue in vivo: Temporal histologic trends. J Endourol. 2007 Oct;21:1159–1166. doi: 10.1089/end.2007.9915. [DOI] [PubMed] [Google Scholar]
- 18.Lake AM, Hall TL, Kieran K, Fowlkes JB, Cain CA, Roberts WW. Histotripsy: Minimally invasive technology for prostatic tissue ablation in an in vivo canine model. Urology. 2008 Mar;72:682–686. doi: 10.1016/j.urology.2008.01.037. [DOI] [PMC free article] [PubMed] [Google Scholar]
- 19.Kuroda K, Chung AH, Hynynen K, Jolesz FA. Calibration of water proton chemical shift with temperature for noninvasive temperature imaging during focused ultrasound surgery. J Magn Reson Imaging. 1998 Jan.–Feb;8:175–181. doi: 10.1002/jmri.1880080130. [DOI] [PubMed] [Google Scholar]
- 20.Huber PE, Jenne JW, Rastert R, Simiantonakis I, Sinn HP, Strittmatter HJ, von Fournier D, Wannenmacher MF, Debus J. A new noninvasive approach in breast cancer therapy using magnetic resonance imaging-guided focused ultrasound surgery. Cancer Res. 2001 Dec;61:8441–8447. [PubMed] [Google Scholar]
- 21.Hazle JD, Stafford RJ, Price RE. Magnetic resonance imaging-guided focused ultrasound thermal therapy in experimental animal models: Correlation of ablation volumes with pathology in rabbit muscle and VX2 tumors. J Magn Reson Imaging. 2002 Feb;15:185–194. doi: 10.1002/jmri.10055. [DOI] [PubMed] [Google Scholar]
- 22.Vanne A, Hynynen K. MRI feedback temperature control for focused ultrasound surgery. Phys Med Biol. 2003 Jan;48:31–43. doi: 10.1088/0031-9155/48/1/303. [DOI] [PubMed] [Google Scholar]
- 23.Amini AN, Ebbini ES, Georgiou TT. Noninvasive estimation of tissue temperature via high-resolution spectral analysis techniques. IEEE Trans Biomed Eng. 2005 Feb;52:221–228. doi: 10.1109/TBME.2004.840189. [DOI] [PubMed] [Google Scholar]
- 24.Damianou CA, Sanghvi NT, Fry FJ, Maass-Moreno R. Dependence of ultrasonic attenuation and absorption in dog soft tissues on temperature and thermal dose. J Acoust Soc Am. 1997 Jul;102:628–634. doi: 10.1121/1.419737. [DOI] [PubMed] [Google Scholar]
- 25.Sun Z, Ying H. A multi-gate time-of-flight technique for estimation of temperature distribution in heated tissue: Theory and computer simulation. Ultrasonics. 1999 Feb;37:107–122. doi: 10.1016/s0041-624x(98)00055-9. [DOI] [PubMed] [Google Scholar]
- 26.Bush NL, Rivens I, ter Haar GR, Bamber JC. Acoustic properties of lesions generated with an ultrasound therapy system. Ultrasound Med Biol. 1993;19(9):789–801. doi: 10.1016/0301-5629(93)90095-6. [DOI] [PubMed] [Google Scholar]
- 27.Miller NR, Bamber JC, ter Haar GR. Imaging of temperature-induced echo strain: Preliminary in vitro study to assess feasibility for guiding focused ultrasound surgery. Ultrasound Med Biol. 2004 Mar;30:345–356. doi: 10.1016/j.ultrasmedbio.2003.11.016. [DOI] [PubMed] [Google Scholar]
- 28.Righetti R. Elastographic characterization of HIFU-induced lesions in canine livers. Ultrasound Med Biol. 1999 Sep;25:1099–1113. doi: 10.1016/s0301-5629(99)00044-7. [DOI] [PubMed] [Google Scholar]
- 29.Hall TL, Fowlkes JB, Cain CA. A real-time measure of cavitation induced tissue disruption by ultrasound imaging backscatter reduction. IEEE Trans Ultrason Ferroelectr Freq Control. 2007 Mar;54:569–575. doi: 10.1109/tuffc.2007.279. [DOI] [PubMed] [Google Scholar]
- 30.Winterroth F, Xu Z, Wang TY, Wilkinson JE, Roberts WW, Fowlkes JB, Cain CA. Tissue fragmentation treatment by pulsed cavitational ultrasound therapy-histotripsy. Proc. IEEE Ultrasonics Symp; New York, NY. 2007. pp. 144–147. [Google Scholar]
- 31.Lake AM, Xu Z, Wilkinson JE, Cain CA, Roberts WW. Renal ablation by histotripsy—Does it spare the collecting system? J Urol. 2008 Mar;179:1150–1154. doi: 10.1016/j.juro.2007.10.033. [DOI] [PubMed] [Google Scholar]
- 32.Umemura S, Cain CA. Acoustical evaluation of a prototype sector-vortex phased-array applicator. IEEE Trans Ultrason Ferroelectr Freq Control. 1992 Jan;39:32–38. doi: 10.1109/58.166807. [DOI] [PubMed] [Google Scholar]
- 33.Hall T, Cain CA. A low cost compact 512 channel therapeutic ultrasound system for transcutaneous ultrasound surgery,” in. American Institute of Physics Conf Proc. 2006:445–449. [Google Scholar]
- 34.Parsons JE, Cain CA, Fowlkes JB. Cost-effective assembly of a basic fiber-optic hydrophone for measurement of high-amplitude therapeutic ultrasound fields. J Acoust Soc Am. 2006 Mar;119:1432–1440. doi: 10.1121/1.2166708. [DOI] [PubMed] [Google Scholar]
- 35.AIUM. Acoustic Output Measurement Standard for Diagnostic Ultrasound Equipment. Laurel, MD: AIUM Publications; 1998. [Google Scholar]
- 36.Duck FA. Physical Properties of Tissue: A Comprehensive Reference Book. London: Academic; 1990. p. 104. [Google Scholar]
- 37.Meyer CR, Boes JL, Kim B, Bland PH, Lecarpentier GL, Fowlkes JB, Roubidoux MA, Carson PL. Semiautomatic registration of volumetric ultrasound scans. Ultrasound Med Biol. 1999 Mar;25:339–347. doi: 10.1016/s0301-5629(98)00148-3. [DOI] [PubMed] [Google Scholar]
- 38.Krucker JF, LeCarpentier GL, Fowlkes JB, Carson PL. Rapid elastic image registration for 3-D ultrasound. IEEE Trans Med Imaging. 2003 Nov;21:1384–1394. doi: 10.1109/TMI.2002.806424. [DOI] [PubMed] [Google Scholar]
- 39.Chivers RC. The scattering of ultrasound by human tissues—Some theoretical models. Ultrasound Med Biol. 1977;3(1):1–13. doi: 10.1016/0301-5629(77)90115-6. [DOI] [PubMed] [Google Scholar]
- 40.O’Donnell M, Mimbs JW, Miller JG. Relationship between collagen and ultrasonic backscatter in myocardial tissue. J Acoust Soc Am. 1981 Feb;69:580–588. doi: 10.1121/1.385433. [DOI] [PubMed] [Google Scholar]
- 41.Hunt JW, Worthington AE, Xuan A, Kolios MC, Czarnota GJ, Sherar MD. A model based upon pseudo regular spacing of cells combined with the randomisation of the nuclei can explain the significant changes in high-frequency ultrasound signals during apoptosis. Ultrasound Med Biol. 2002 Feb;28:217–226. doi: 10.1016/s0301-5629(01)00494-x. [DOI] [PubMed] [Google Scholar]
- 42.Kolios MC, Czarnota GJ, Lee M, Hunt JW, Sherar MD. Ultrasonic spectral parameter characterization of apoptosis. Ultrasound Med Biol. 2002 May;28:589–597. doi: 10.1016/s0301-5629(02)00492-1. [DOI] [PubMed] [Google Scholar]
- 43.Baddour RE, Sherar MD, Hunt JW, Czarnota GJ, Kolios MC. High-frequency ultrasound scattering from microspheres and single cells. J Acoust Soc Am. 2005 Feb;117:934–943. doi: 10.1121/1.1830668. [DOI] [PubMed] [Google Scholar]
- 44.Tunis AS, Czarnota GJ, Giles A, Sherar MD, Hunt JW, Kolios MC. Monitoring structural changes in cells with high-frequency ultrasound signal statistics. Ultrasound Med Biol. 2005 Aug;31:1041–1049. doi: 10.1016/j.ultrasmedbio.2005.04.020. [DOI] [PubMed] [Google Scholar]
- 45.Hall CS, Scott MJ, Lanza GM, Miller JG, Wickline SA. The extracellular matrix is an important source of ultrasound backscatter from myocardium. J Acoust Soc Am. 2000 Jan;107:612–619. doi: 10.1121/1.428327. [DOI] [PubMed] [Google Scholar]
- 46.Insana MF, Hall TJ, Fishback JL. Identifying acoustic scattering sources in normal renal parenchyma from the anisotropy in acoustic properties. Ultrasound Med Biol. 1991;17(6):613–626. doi: 10.1016/0301-5629(91)90032-r. [DOI] [PubMed] [Google Scholar]
- 47.Kundu T, Bereiter-Hahn J, Karl I. Cell property determination from the acoustic microscope generated voltage versus frequency curves. Biophys J. 2000 May;78:2270–2279. doi: 10.1016/S0006-3495(00)76773-7. [DOI] [PMC free article] [PubMed] [Google Scholar]
- 48.Wagner RF, Insana MF, Brown DG. Statistical properties of radio-frequency and envelope-detected signals with applications to medical ultrasound. J Opt Soc Am A. 1987 May;4:910–922. doi: 10.1364/josaa.4.000910. [DOI] [PMC free article] [PubMed] [Google Scholar]
- 49.Insana MF. Modeling acoustic backscatter from kidney microstructure using an anisotropic correlation function. J Acoust Soc Am. 1995 Jan;97:649–655. doi: 10.1121/1.412287. [DOI] [PubMed] [Google Scholar]
- 50.Insana MF, Wagner RF, Brown DG, Hall TJ. Describing small-scale structure in random media using pulse-echo ultrasound. J Acoust Soc Am. 1990 Jan;87:179–192. doi: 10.1121/1.399283. [DOI] [PMC free article] [PubMed] [Google Scholar]
- 51.Lizzi FL, Greenebaum M, Feleppa EJ, Elbaum M, Coleman DJ. Theoretical framework for spectrum analysis in ultrasonic tissue characterization. J Acoust Soc Am. 1983 Apr;73:1366–1373. doi: 10.1121/1.389241. [DOI] [PubMed] [Google Scholar]
- 52.Mamou J, Oelze ML, O’Brien WD, Jr, Zachary JF. Identifying ultrasonic scattering sites from three-dimensional impedance maps. J Acoust Soc Am. 2005 Jan;117:413–423. doi: 10.1121/1.1810191. [DOI] [PubMed] [Google Scholar]
- 53.Oelze ML, O’Brien WD., Jr Method of improved scatterer size estimation and application to parametric imaging using ultrasound. J Acoust Soc Am. 2002 Dec;112:3053–3063. doi: 10.1121/1.1517064. [DOI] [PubMed] [Google Scholar]
- 54.Oelze ML, Zachary JF, O’Brien WD., Jr Characterization of tissue microstructure using ultrasonic backscatter: Theory and technique for optimization using a Gaussian form factor. J Acoust Soc Am. 2002 Sep;112:1202–1211. doi: 10.1121/1.1501278. [DOI] [PubMed] [Google Scholar]


