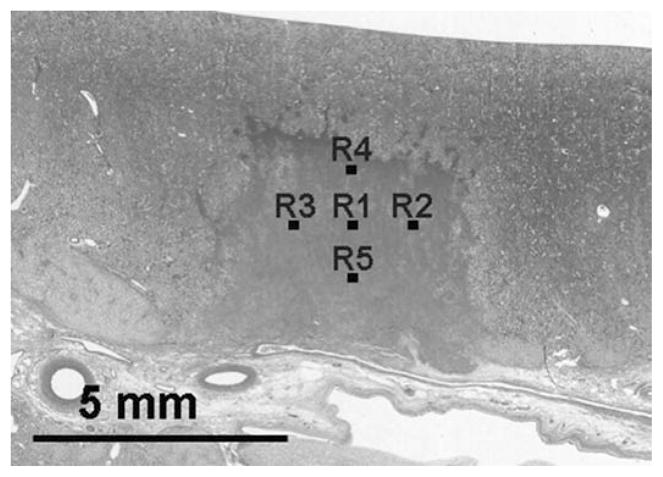
Fig. 4.
The homogeneous area in the center of the histology image indicates a lesion generated by histotripsy. Five regions (R1–R5) in the lesion were selected to examine the percentage of normal-appearing cell nuclei in the treated volume. The numbers of normal-appearing cell nuclei in each image were counted. The means and standard deviations of nuclei count from these 5 regions were calculated.

