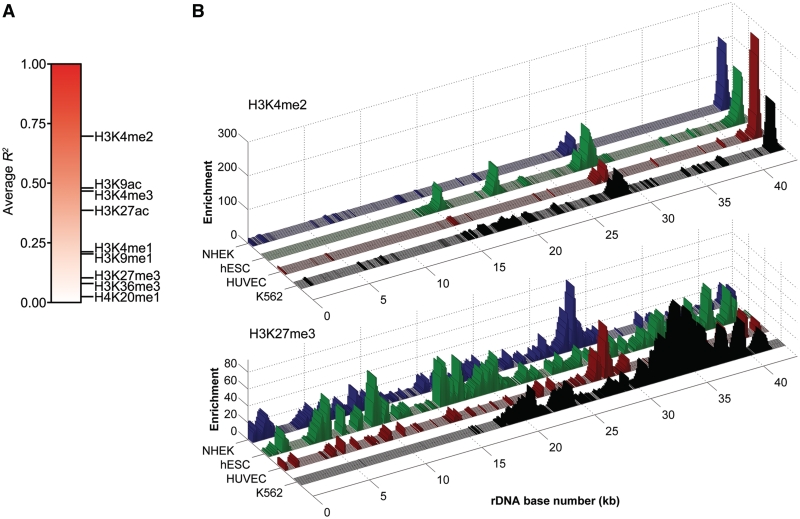
Figure 2.
Comparison of rDNA histone modifications in multiple cell types. (A) Gradient plot representing average correlation scores for each histone modification at rDNA. (B) Three-dimensional representations of H3K4me2 and H3K27me3 ChIP-seq data, illustrating the general correlation of active modifications and lack of correlation of repressive modifications between cell types.

