Figure 5.
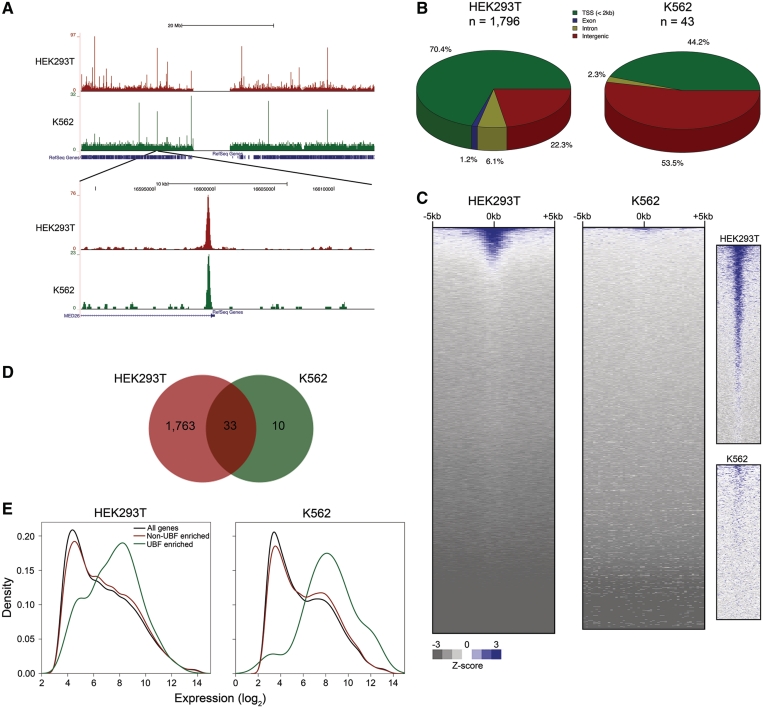
UBF is associated with nucleoplasmic chromatin. (A) UCSC Genome Browser view of UBF binding on human chromosome 19 in HEK293T and K562 cells. A zoomed-in view is shown in the lower panel. (B) Distribution of UBF binding sites with respect to RefSeq genes. (C) UBF signal ± 5 kb of all unique TSSs in the human genome in descending order of average signal intensity. The panels on the right show a zoomed-in view of the topmost area of each heatmap, showing details of UBF signal in each cell type. (D) Venn diagram indicating overlap of UBF binding sites in HEK293T and K562 cells. (E) Density histograms of gene expression levels for all genes, genes with significant UBF peaks <2 kb from their TSS, or genes with low or no UBF binding at their TSS. HEK293T UBF enriched versus all genes, P = 1.85 × 10⁻²⁸; HEK293T UBF enriched versus non-enriched genes, P = 3.29 × 10⁻²¹; K562 UBF enriched vs. all genes, P = 0.0013; K562 UBF enriched versus non-enriched genes, P = 0.0031 by t-test.

