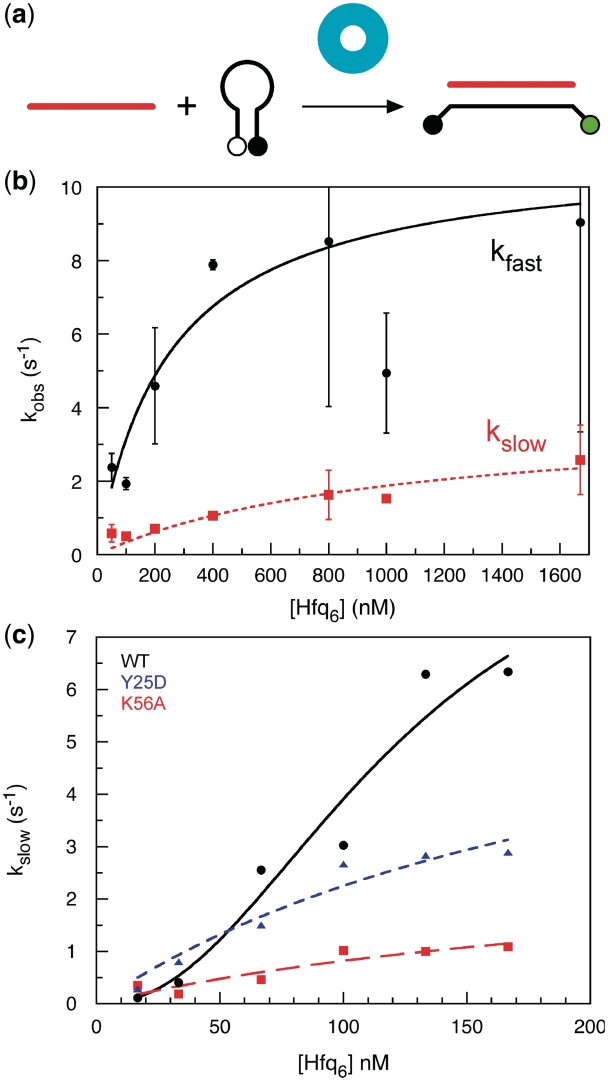
Figure 2.
Annealing rate increases with Hfq concentration. (a) Scheme as in Figure 1. (b) Observed annealing rates were measured by stopped-flow fluorescence in TNK buffer at 30°C, using 50 nM dMB-D16, 100 nM D16 RNA and 50–1600 nM Hfq hexamer. Individual progress curves were fit to Equation (1) (‘Materials and Methods’ section). Error bars show the standard deviation between trials; the small amplitude of the fast phase >600 nM Hfq6 accounts for the greater uncertainty in the rate constants. The increase in kobs was fit to a single-site binding isotherm, with [Hfq]1/2 = 250 ± 80 nM (kfast, black circles) and 1.0 ± 6 µM Hfq (kslow, red squares). (c) Effect of Hfq mutations on annealing activity. Distal face mutation Y25D (blue triangles) decreases activity less than proximal face mutation K56A (red squares). Experiments as above but with 100 nM D16 RNA in HB buffer, both of which increase overall activity. Rate constants for the slow phase are shown. Data for the wild-type Hfq were fit to a cooperative binding model.

