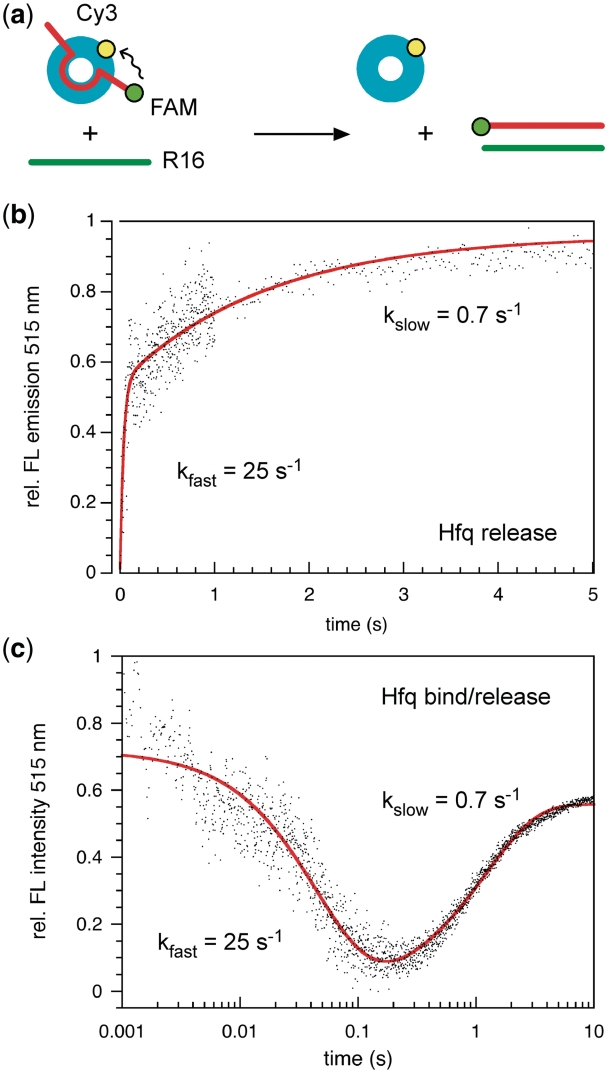
Figure 4.
Hfq binding and release during annealing. (a) Hfq displacement was measured by pre-mixing 100 nM D16-FAM (red) with 0.5 µM Hfq-Cy3, and challenging the D16-FAM • Hfq-Cy3 complex with 100 nM complementary RNA (R16, green line). (b) Release of Hfq results in a loss of FRET and increase in FAM emission at 515 nm. Data (black) were fit to a double exponential equation (red curve), yielding observed rate constants of 25 ± 1 s−1 and 0.7 ± 0.2 s−1 (four trials). (c) Ternary complex formation. R16 RNA (100 nM) was pre-mixed with 0.5 μM Hfq-Cy3, and challenged with 100 nM complementary D16-FAM RNA. Binding of D16-FAM to the R16 • Hfq-Cy3 complex results in FRET and decreased FAM emission at 515 nm; subsequent release of Hfq lowers FRET and increases FAM emission. Data were fit to a double exponential (red curve); observed rate constants were 19 ± 1 s−1 and 0.86 ± 0.03 s−1 (five shots).

