Figure 3.
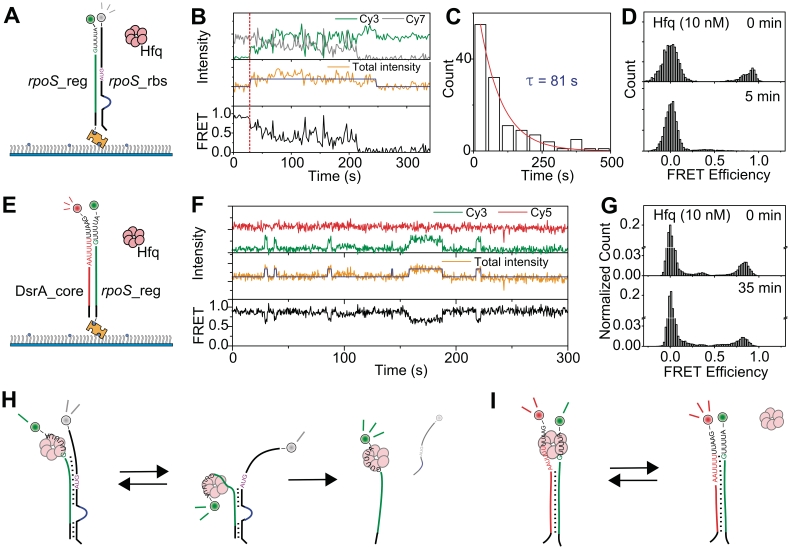
Unwinding mechanism of Hfq. (A) Experimental scheme of rpoS_reg:rpoS_rbs unwinding. Pre-annealed rpoS_reg:rpoS_rbs was immobilized on a polymer-coated quartz surface, and Hfq (10 nM) was added into the detection chamber. (B) Example traces of fluorescence intensities (top: green for Cy3 and gray for Cy7; middle: orange with blue for the sum of Cy3 and Cy7) and corresponding FRET (bottom: black). Blue lines in the middle panel were added as an eye-guide. The red dashed line indicates the injection point of Hfq. (C) Unwinding time of rpoS_reg:rpoS_rbs complex after the binding of Hfq. (D) FRET histograms before the injection of Hfq (top) and after 5 min incubation with Hfq (bottom). (E) Experimental scheme of DsrA_core:rpoS_reg unwinding. DsrA:rpoS_reg complex was immobilized on a polymer-coated quartz surface and Hfq (10 nM) was added into the detection chamber. (F) Representative fluorescence intensity and FRET time traces of the experiment described in (E). (G) FRET histograms of the experiment described in (E) before the injection of Hfq (top), and after the incubation with Hfq for 35 min (bottom). Model of rpoS_reg:rpoS_rbs unwinding by Hfq (H), and that of DsrA:rpoS_reg unwinding (I).

