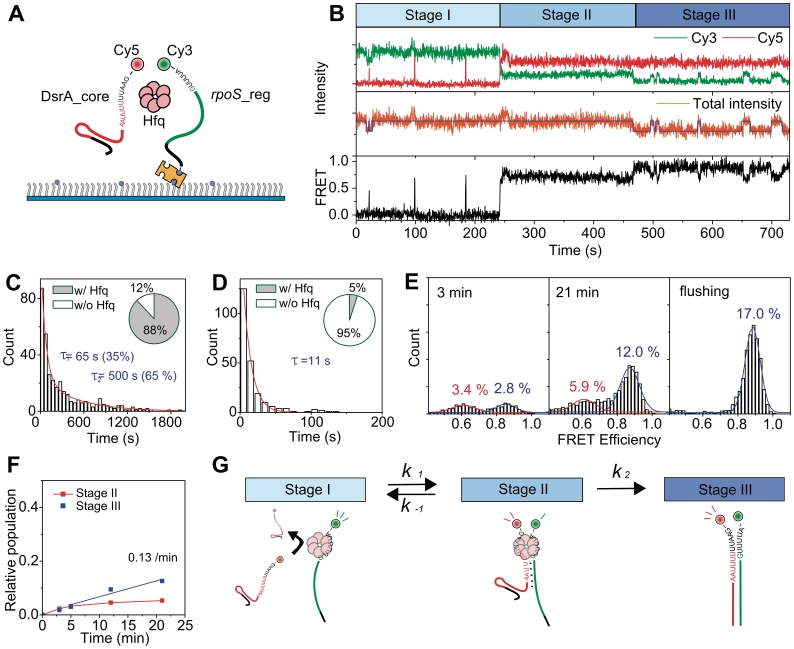
Figure 4.
Annealing of DsrA_core and rpoS_reg. (A) Schematic diagram of the experiment. Cy3-labeled rpoS_reg was immobilized on a polymer-coated quartz surface, and Cy5-labeled DsrA_core (5 nM) and Hfq (2 nM) were added into the detection chamber. (B) Representative time traces of single-molecule FRET experiments. The same color coding as in Figure 3f was used. The annealing process are classified into three distinct stages (stages I–III). (C) Binding lifetime of Hfq to rpoS_reg in stage I, and the portion of Hfq-bound rpoS_reg (inset). (D) Binding lifetime of Hfq to DsrA_core:rpoS_reg complex in stage III, and the portion of Hfq-bound DsrA_core:rpoS_reg complex (inset). (E) Evolution of FRET histograms after the delivery of DsrA_core and Hfq. Three FRET states were detected; a zero-FRET state corresponding to the absence of DsrA_core was omitted here for clarity. The last histogram was obtained after washing out the detection chamber at 24 min with a high-salt buffer (300 mM NaCl) to dissociate Hfq proteins. (F) Kinetics of product accumulation of DsrA_core:rpoS_reg. (G) A proposed model of the DsrA_core:rpoS_reg annealing by Hfq.

