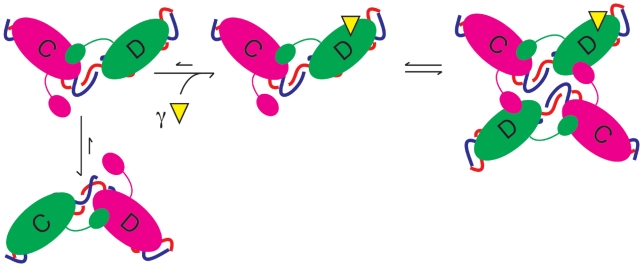
Figure 6.
Schematic diagram of activation of XerD by FtsKγ. The model is based upon numerous crystal structures where the direction of DNA bend determines which monomer is active (shown in green) or inactive (magenta) upon duplex DNA. In the absence of FtsKγ (yellow triangle) the equilibrium is skewed towards the XerC-active state. Upon interaction of XerD with FtsKγ, the equilibrium changes so that the XerD-active state is now favoured. This state then can make a productive synapse, wherein XerD exchanges the first pair of strands to form a HJ, which is subsequently resolved by XerC.

