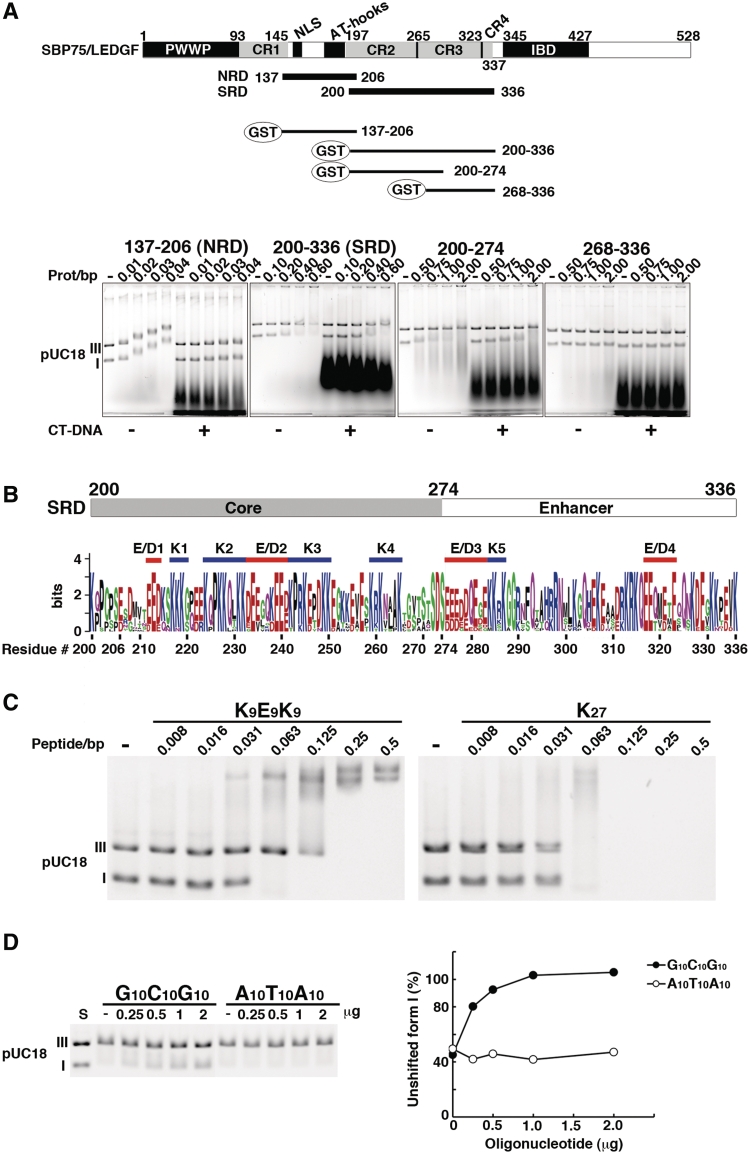
Figure 4.
Further characterization of DNA-binding domains of SBP75/LEDGF. (A) Subregions of the central portion (137–336) were expressed as GST-fusion proteins and their DNA binding properties were analyzed by EMSA. Domain structure of SBP75/LEDGF is illustrated on the top, including the charged region (CR1–4) and newly identified DNA-binding domains: non-specific DNA-recognition domain (NRD) and supercoiled DNA-recognition domain (SRD). GST-fused fragments used in the assay are shown beneath. Numbers indicate the residue number of SBP75/LEDGF. Shown in the lower panels are mobility shift patterns of supercoiled (I) and linear (III) DNA for each protein. Increasing amounts of GST-fused proteins were incubated with DNA in the absence (−) or presence (+) of CT-DNA. Prot/bp stands for the molar ratio of protein/base pare of DNA. (B) Visual assessment of essential elements in SRD by using sequence logo representation. The minimal element for supercoiled DNA binding (core) and a region that enhances the supercoil-specific binding (enhancer) are indicated on the top. Homologous regions of 13 species were aligned (Supplementary Figure S5A), and each amino acid residue was scaled by the total bits of information multiplied by the relative occurrence of the amino acid residue at the position. Attached residue numbers are for rat SBP75/LEDGF. Red bars indicate acidic clusters (E/D1–E/D4) and blue bars indicate lysine clusters (K1–K5). For cluster definition see in the text. (C) EMSA analysis of a polypeptide K9E9K9 that mimics the cluster structure of the core (K2–E/D2–K3). Increasing amounts of K9E9K9 or K27 (control) were incubated with forms I and III pUC18 DNA. In this experiment, actual amount of added polypeptide was 0.5 µg per reaction at the polypeptide/base pair molar ratio (peptide/bp) of 0.5. (D) Competitive effects of double-stranded oligonucleotides G10C10G10 and A10T10A10 on the binding of supercoiled DNA with SRD. Increasing amounts of the oligonucleotides indicated on top were added into the reaction mixture containing 6.5 µg of GST-200–336 (equivalent to 0.5 protein/bp) (left panel). Band densities of form I DNA relative to that of DNA alone (S) are plotted (right panel).

