Figure 6.
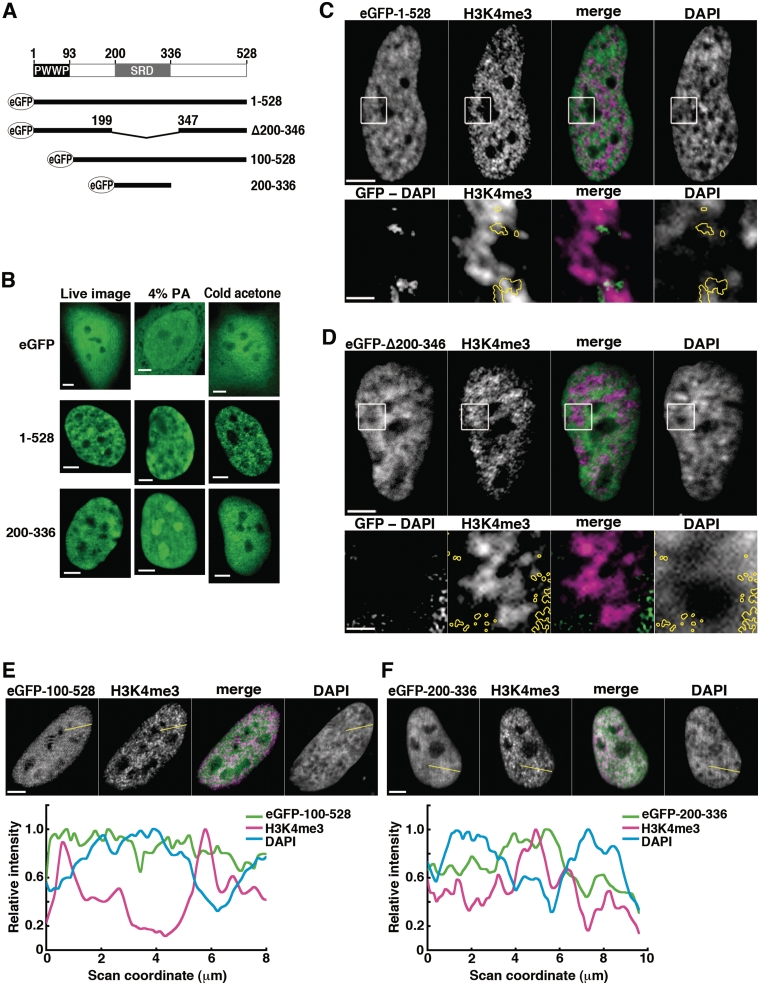
Analysis of domain function for intranuclear localization: eGFP-fused SBP75/LEDGF deletion mutants expressed in HeLa cells. (A) Schematic representation of eGFP-fused proteins in relation to domains of rat SBP75/LEDGF, PWWP and SRD. Amino acid residue numbers are indicated. (B) Effects of fixation conditions. eGFP-SBP75/LEDGF (1–528), eGFP-SRD (200–336) or eGFP (control) were transiently expressed in HeLa cells, and eGFP signal was detected in live cells (left panels), in cells fixed with 4% paraformaldehyde (middle panels), and in cells pretreated with cold acetone before fixation with 0.75% paraformaldehyde (right panels). Scale bars, 5 µm. (C–F) Distribution of transcription sites (H3K4me3) in relation to locations of eGFP-fused SBP75/LEDGF deletion mutants expressed in HeLa cells. Cells were treated with cold acetone prior to fixation with paraformaldehyde. The fixed cells were immunolabeled with anti-H3K4me3 antibody (1/1000×) and Alexa 594-conjugated goat anti-rabbit IgG (5 µg/ml). eGFP was visualized directly as fluorescence. Boxed area in upper panels of (C) and (D) was magnified and shown in lower panels. In the panels designated ‘GFP-DAPI’, DAPI signal was subtracted pixel-by-pixel from the eGFP signal and the remaining signal is shown here after background subtraction (see Supplementary Figure S9 for detailed description). The region is outlined by yellow circles in other panels for reference. In panels E and F, relative signal intensities were scanned along the yellow lines drawn and plotted in the graphs shown on the bottom. All the merged images were made from SBP75/LEDGF (green) and H3K4me3 (magenta). Scale bars designate 5 µm except in the magnified images in panels C and D, which represent 1 µm.

