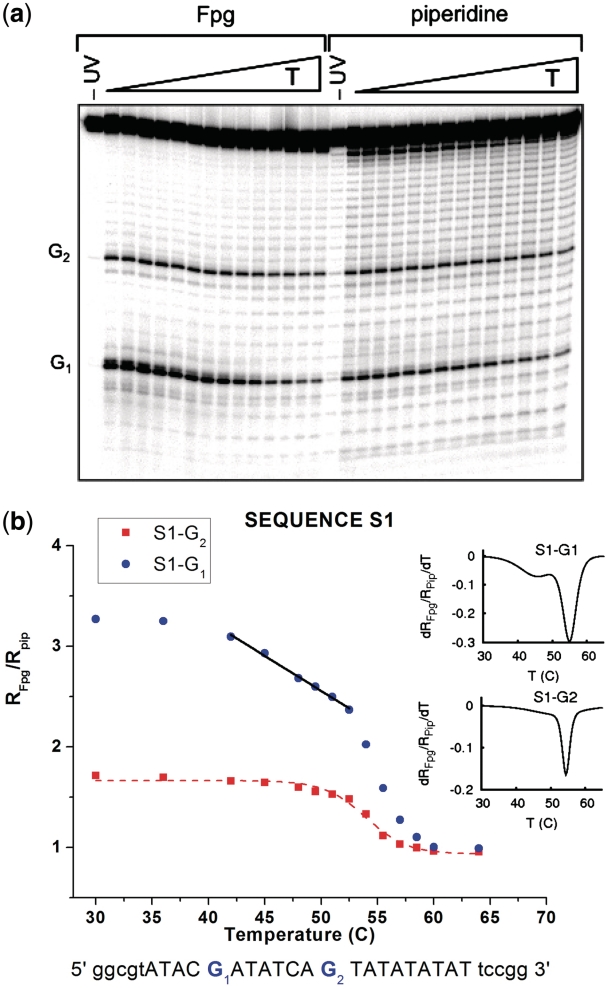
Figure 3.
Temperature dependence of the ratios RFpg/Rpip for the guanine probes G and G2 in sequence S1. The top panel (a) is an example of our experimental sequencing gel images. Each vertical stripe shows the results at a given temperature (increasing from left to right, as indicated on top of the image). A mark along a stripe corresponds to the value of RFpg, Rpip at a particular position along the DNA sequence. Characteristic points are indicated by a label on the left of the panel. The bottom panel (b) shows quantitative data extracted from the gel images analyzed in our experiment. The experimental errors are within the size of the data points. Data symbol markers are colored following the same convention as the Guanine probes highlighted in Figure 2. The straight lines, in the temperature domain corresponding to premelting, are linear fits, pointing out a two step melting transition in this domain. Dotted lines are non-linear curve fits following a sigmoidal one step melting transition typically found in common DNA melting curves.

