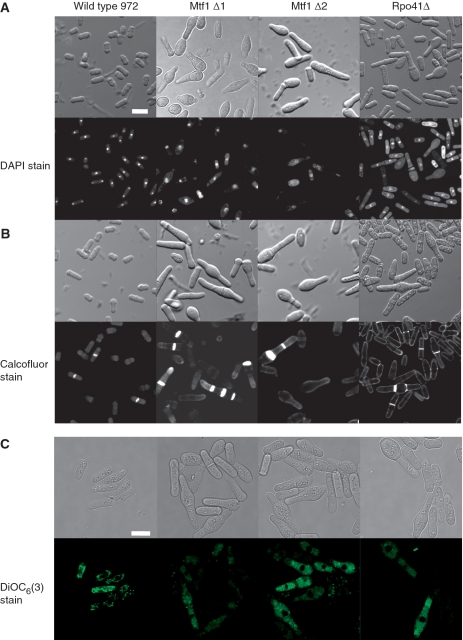
Figure 2.
The phenotype of mtf1 or rpo41 deletions. (A) Wild-type 972 cells and mtf1Δ1 and mtf1Δ2 or rpo41Δ cells grown on YES/YES + G418 plates and cells were fixed and stained with DAPI. The top row shows phase contrast images of unstained cells, the bottom row shows DAPI stained cells viewed by confocal microscope. Bar is 10 μm. (B) Wild-type 972 cells and mtf1Δ1 and mtf1Δ2 or rpo41Δ cells were grown on plates and cells were fixed and stained with Calcofluor. The top row shows phase contrast images of unstained cells, the bottom row shows Calcofluor stained cells viewed by confocal microscope. (C) Wild-type 972 cells, mtf1Δ1, mtf1Δ2 and rpo41Δ cells were stained with the green fluorescent mitochondrial stain DiOC6(3) and cells were observed by confocal microscope. Bar is 10 μm.

