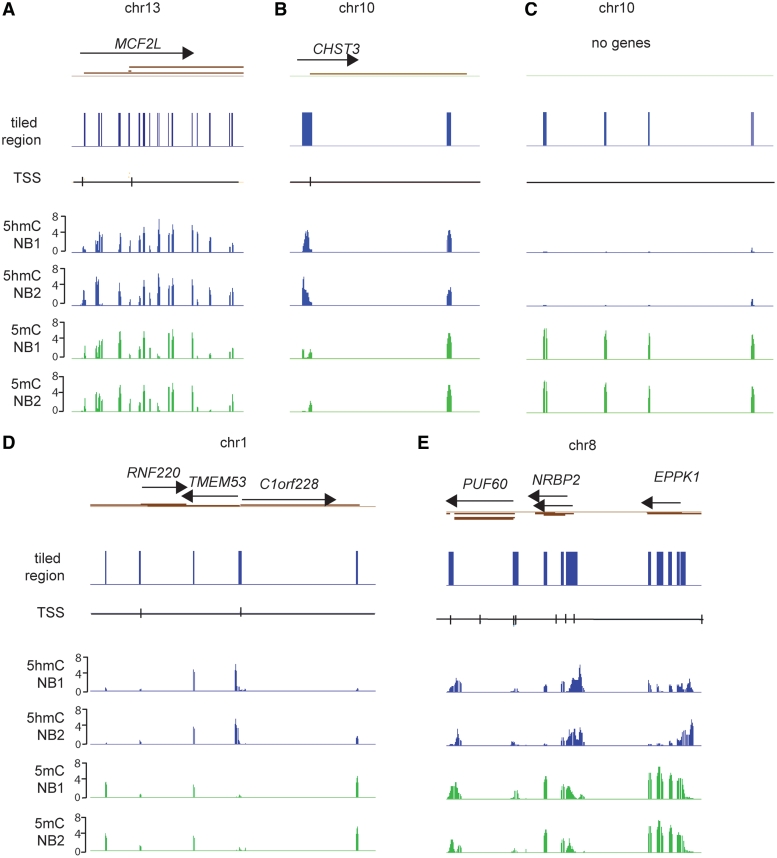
Figure 2.
Mapping of 5hmC in human brain DNA. Several examples of mapping of 5hmC and 5mC in human brain DNA are shown. The blue columns indicate the tiled regions. Green peaks reflect 5mC and blue peaks show the distribution of 5hmC peaks in each of two different normal brain samples (NB1 and NB2). The TSSs and transcripts are indicated. The data are presented as P-value scores (-log10 of the P-value). (A) The MCF2L gene on chromosome 13; (B) the CHST3 gene on chromosome 10; (C) an area of chromosome 10 is shown where several CpG islands are located in a gene-free region. Such regions are often enriched for 5mC peaks but lack 5hmC. (D) The RNF220, TMEM53 and C1orf228 genes on chromosome 1; (E) the PUF60, NRBP2 and EPPK1 genes on chromosome 8.

