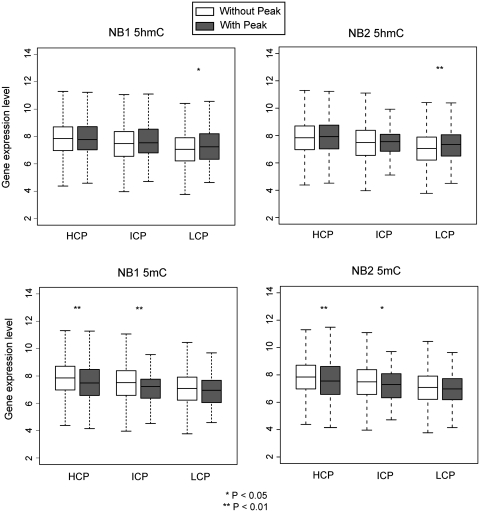
Figure 5.
Correlation between 5hmC and 5mC peaks at promoters and gene expression levels. Gene expression data were obtained from GEO dataset GSE3790. The raw CEL files were processed by RMA and average log2 intensities among biological replicates were calculated to represent their expression levels. Genes were separated into groups having a peak for 5mC or 5hmC or not having a peak at their promoters. Gene expression levels (log2 scale) were assigned for these two categories and represented as box plots and their difference was determined by Student's t-test. **P-values were significant for 5mC at promoters with high and intermediate CpG contents (HCP and ICP, P < 0.05 for both NB1 and NB2) but not for low CpG (LCP) promoters (P > 0.05 for both NB1 and NB2). For HCP and ICP promoters, there was no significant difference between the expression levels of 5hmC-marked promoters and other promoters (P > 0.05 for both NB1 and NB2) but expression levels were positively correlated for LCP promoters (P < 0.05).

