Figure 3.
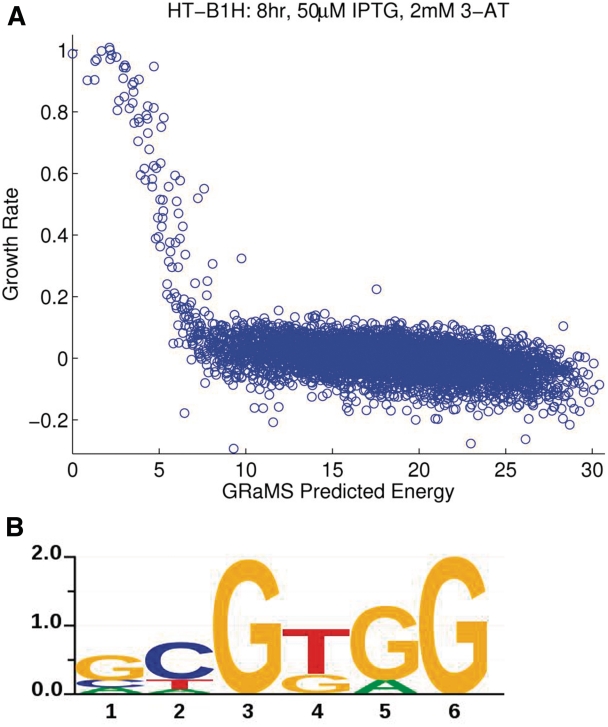
Results of CV-B1H on Zif268 analyzed with GRaMS. (A) Plot of predicted energies versus growth rates per 6-mer. The GRaMS PWM (8 h, 50 μM IPTG, 2 mM 3-AT) was used to predict the energies. The growth rates (shifted so that the median value is zero) are from the 8 h, 50 μM IPTG, 2 mM 3-AT data set used to estimate the GRaMS PWM. (B) Sequence logo for the GRaMS PWM obtained from the same data set. The y-axis indicates the information content of each position in bits. Sequence logos were produced using in-house software, svgSeqLogo, written by RGC.

