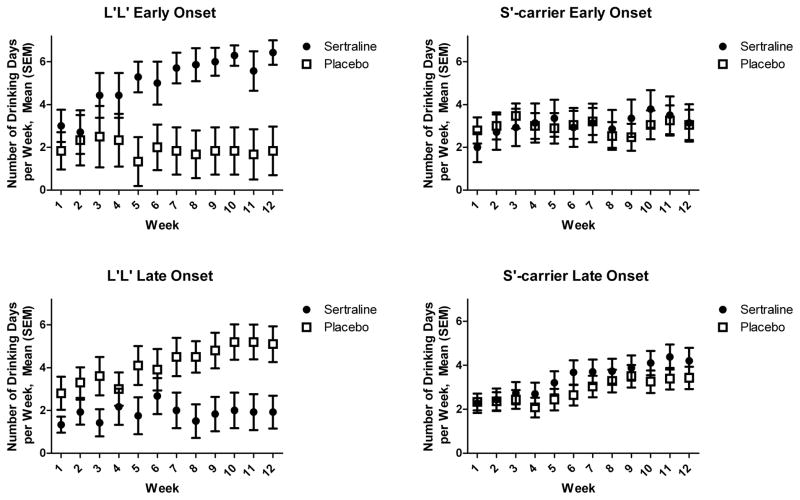
Figure 1.
Number of Drinking Days by Study Week, Age of Onset of Alcohol Dependence, Medication Group, and 5-HTTLPR Genotype. Values are mean (±SEM) and reflect drinking behavior during the week identified on the x-axis. As in the analyses, the figures include the intent-to-treat sample and imputed values for missing data. The decrease in drinking days from baseline to week 1 is not shown in the figure, but can be ascertained using data from Table 1.

