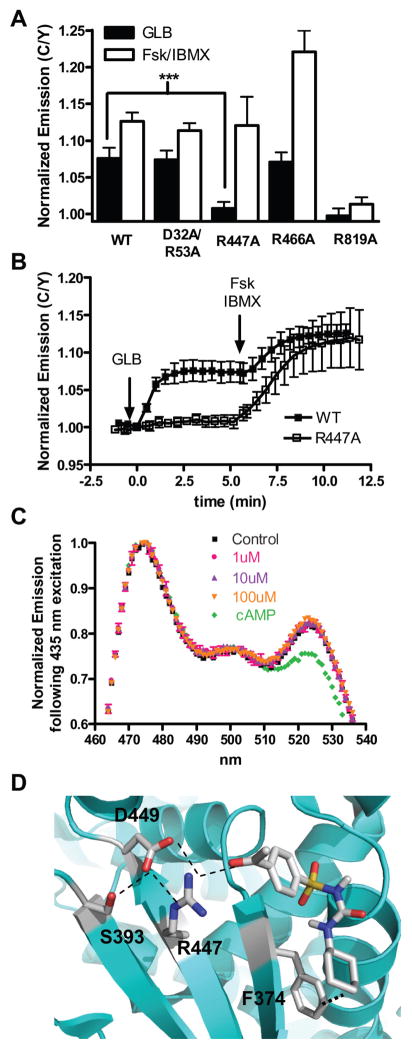
Figure 2. R447 is specifically involved in SU binding to and activation of Epac2.
(A) The GLB (5 μM) and cAMP (50 μM Fsk plus 100 μM IBMX) responses of WT (N = 10), D32A/R53A (N = 7), R447A (N = 12), R466A (N = 8), and R819A (N = 8) Epac2 biosensors in HEK293T cells. Values are depicted as mean ± s.d. ***P <1E-08. (B) Time course depicting the diminished GLB-induced response of the R447A mutant (□) Epac2 biosensor compared to the WT (■) Epac2 biosensor. (C) Emission spectrum of the R447A biosensor excited at 435 nm in the basal state (■), after GLB [1 μM (
 ); 10 μM (
 ); 100 μM (
 )] addition, and after cAMP (500 μM) addition (
 ). (D) Molecular docking studies identify a putative SU binding site where ACT hydrogen bonds with R447 of Epac2 and makes Van der Waals contacts with F374.

