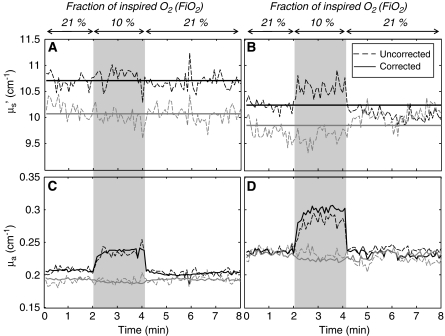
Figure 2.
Reduced scattering coefficient (A, B) and absorption coefficient (C, D) of brain tissue measured in two different animals (A, C: first animal; B, D: second animal) during the hypoxia protocol. Black lines refer to a wavelength of 690 nm and gray lines to 830 nm. Dashed lines are the measurements of both optical coefficients from intensity and phase measurements (uncorrected). Solid lines are measurements from intensity only, after the reduced scattering coefficient has been set to a constant value (corrected) (average over the whole protocol).

