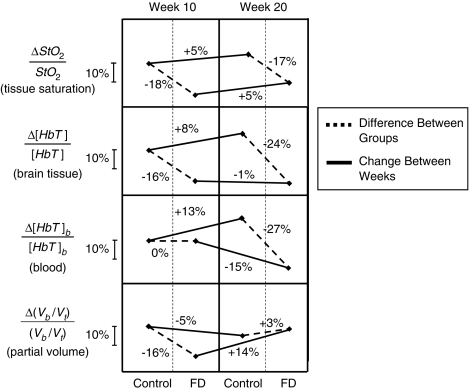
Figure 5.
Summary of relative differences in cerebral tissue hemoglobin saturation (StO2), total hemoglobin concentration in tissue ([HbT]), blood hemoglobin concentration ([HbT]b), and partial blood volume in brain tissue (Vb/Vt) between animal groups (control and folate-deficient (FD) rats) at each time point and change within each group between weeks (week 10 and week 20 after the onset of the FD diet). It is important to note that such comparisons are only possible because of the absolute noninvasive near-infrared spectroscopy (NIRS) measurements of tissue hemoglobin concentration and saturation performed in this study.

