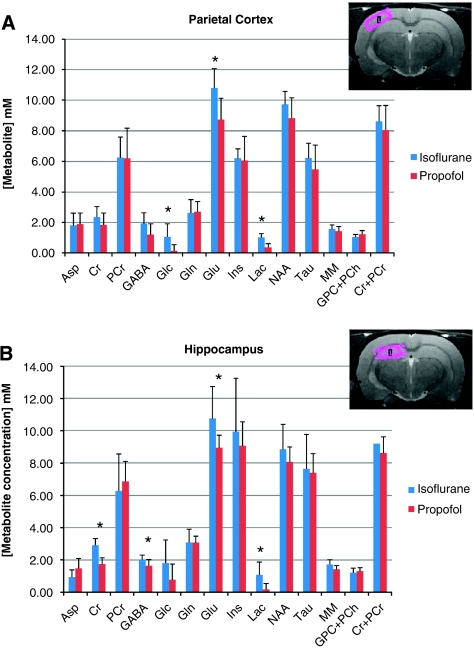
Figure 3.
(A) LCModel quantification of metabolites from rat parietal cortex during anesthesia with 1 minimal alveolar concentration (1MAC) isoflurane (dark blue) or 1MAC equivalent propofol (red). The anatomical magnetic resonance imaging (MRI) image in the upper right corner shows the typical location of the parietal voxel for magnetic resonance spectroscopy (1HMRS). Statistical analysis demonstrates significant higher concentrations of lactate (Lac; P=0.00003), glutamate (P=0.0049), and glucose (P=0.0085) in rats exposed to 1MAC isoflurane compared with 1MAC equivalent propofol. (B) LCModel quantification of metabolites from rat hippocampus during anesthesia with isoflurane (dark blue) or propofol (red). The anatomical MRI image in the upper right corner shows the typical location of the hippocampal voxel for 1HMRS. Statistical analysis demonstrates significant higher concentrations of Lac (P=0.0048), glutamate (P=0.016), γ-aminobutyric acid (P=0.029), and creatine (P=0.00001) in rats exposed to 1MAC isoflurane compared with 1MAC equivalent propofol. For color figure see html version.

