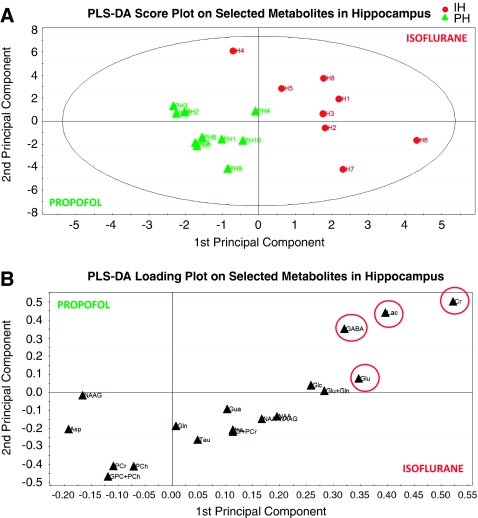
Figure 6.
In the hippocampus, the metabolite concentrations calculated from the LCModel were used for the metabolomic analysis; and the partial least square discriminative analysis revealed a cumulative Q2 value of 0.61 on the first and second, indicating a good fit of the data according to the classification (i.e., propofol versus isoflurane). The corresponding score plot (A) shows the separation of the two experimental groups (in A each green triangle in the score plot represents a propofol-anesthetized rat; and each of the red circles represents an isoflurane-anesthetized rat). The loading plot demonstrates that creatine ([Cr]) and lactate ([lac]) are most important for the separation compared with glutamate (cf. B). For color figure see html version.

