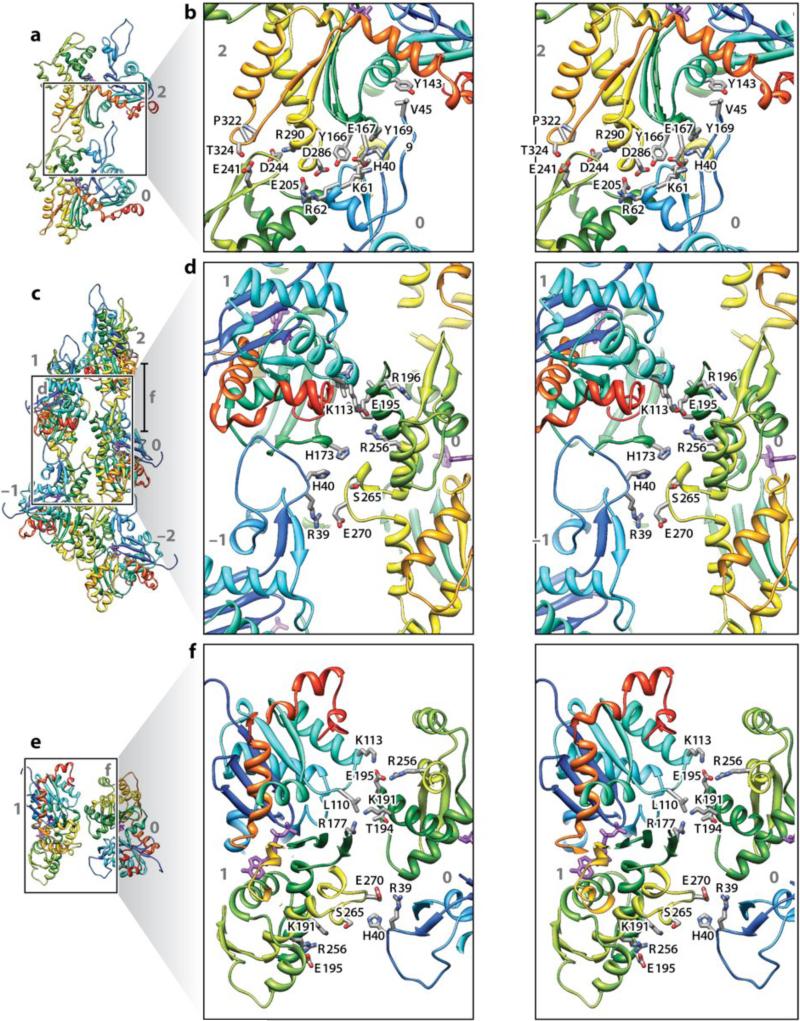
Figure 4.
Intermolecule bonding in F-actin. Shown are five actin molecules labeled –2 to +2. The run of the protein chain is shown as a secondary structure cartoon color-coded from blue (N terminus) to red (C terminus). Interacting side chains are shown as sticks. Panels b, d, and f are stereo pairs. Panels a and b show the main longitudinal interface between molecules 0 and 2. Panels c and d show the transverse interaction across the helix axis in the neighborhood of the plug. This interaction also has contributions from the D-loop. Panels e and f show the transverse interaction higher up (see right hand side of panel c for a definition of panel f) involving loops 195--198 and 108--113. (Reprinted by permission from Macmillan Publishers Ltd: Nature 467:724-728, copywrite 2010)

