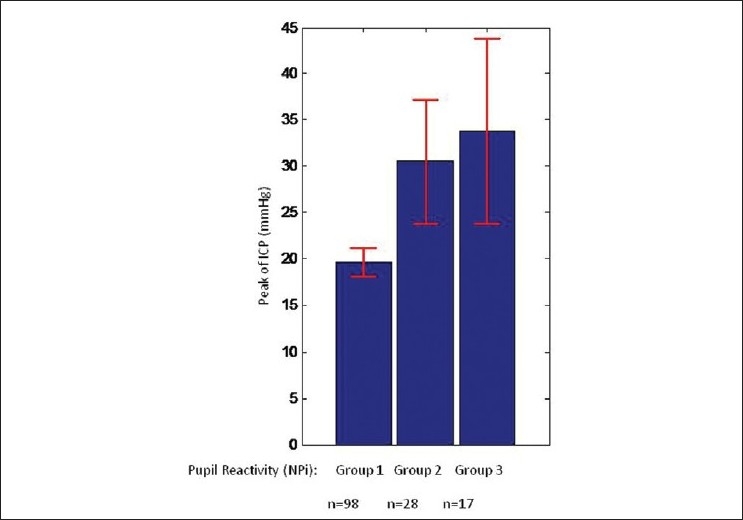
Figure 2.

Peak of ICP was defined for each single patient as the maximum event of sustained ICP. The distribution of peak of ICP varied depending on the pupil NPi reactivity score. Those patients with normal pupil reactivity NPi (3–5, Group 1) had the lowest ICP. Those with one or more occurrences of abnormal NPi (<3, Group 2) had a significantly larger distribution of sustained ICP. Group 3, with the highest sustained ICPs, includes those patients who developed or had occurrences of a nonreactive pupil. Red error bars indicate 95% Confidence Interval (CI)
