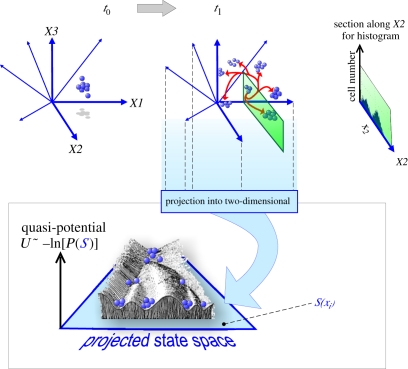
Figure 2.
Integration of the three perspectives, state space, high-dimensionality and heterogeneity of populations, into a systems dynamics picture and its relationship to Waddington's [48] ‘Epigenetic Landscape’ (see text). State-space dimensions are represented by the blue arrows/axes. Using the same notation as in figure 1, a starting population of cells (t0) is shown expanding, owing to gene-expression noise and proliferation, into predestined clusters (t1). Histogram for dimension X2 is shown, obtained from the information contained in a state-space section parallel to X2 (green). Projection of the high-dimensional state space into a two-dimensional plane (light blue) and plotting the values of the inverse natural logarithm (ln) of the steady-state probability P(S) to find a cell at each position S, as the ‘quasi-potential’ U (the z-axis) generates the landscape. Note that the z-axis, U = −ln(P) does not represent the ‘true’ energy potential that drives the development (rolling down of the balls)—see text. As above, each blue ball represents a cell and its network state S.

