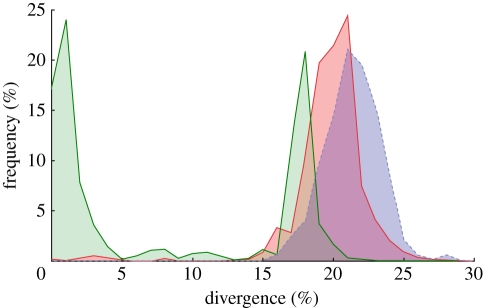
Figure 4.
Pairwise genetic distances calculated among 866 individuals belonging to 105 species of Collembola for the mtDNA COI gene. Frequencies of pairwise distances calculated between individuals belonging to the same morphologically recognized species are shown in green. Frequencies of pairwise differences calculated between individuals belonging to the same genus (but not the same species) are shown in red. Frequencies of pairwise differences calculated between individuals belonging to the same family (but not the same genus) are shown in blue. Green, within species; red, within genera; blue, within families.

