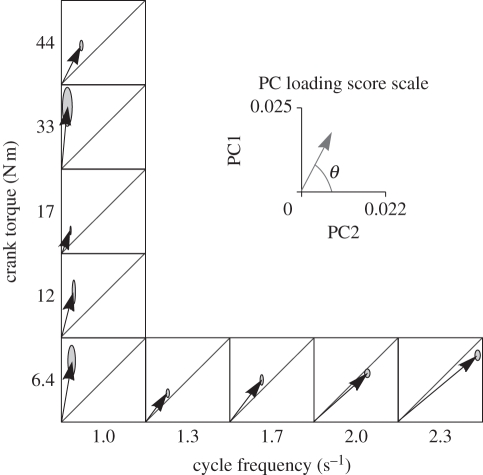
Figure 4.
Principal component (PC) loading score representation of the EMG from the medial gastrocnemius for cycling at a range of mechanical conditions. Data taken from Wakeling et al. [32], and PCs calculated from the EMG for the medial gastrocnemius. Vectors show the PC1–PC2 loading scores for each condition, and ellipses show the s.e.m. for the vectors. Note how the angle θ decreases as the cycle frequency increases and this indicates changes to the spectral properties of the EMG that are consistent with the recruitment of faster motor units.

